Cooper stock forecast 2027–2029
MyStockButler's October 2026 analysis: Cooper's weighted forecast is $43.77 in October 2027 and $60.30 in October 2029. It hinges on lens recovery and cash generation.
Where could Cooper's shares be by 2029?
The weighted forecast keeps Cooper Companies below today’s price through October 2029. The probability-weighted price is $43.77 in October 2027, a 28% loss including dividends. It reaches $51.16 in October 2028, a 16% loss, and $60.30 in October 2029, a 1% loss.
The final-year outcomes range from $28.51 in the bear case to $101.59 in the bull case, against today’s $61.21. The bear, base and bull probabilities are 29%, 53% and 18%, respectively, because recurring lens demand supports the middle path while execution and financing risks remain material.
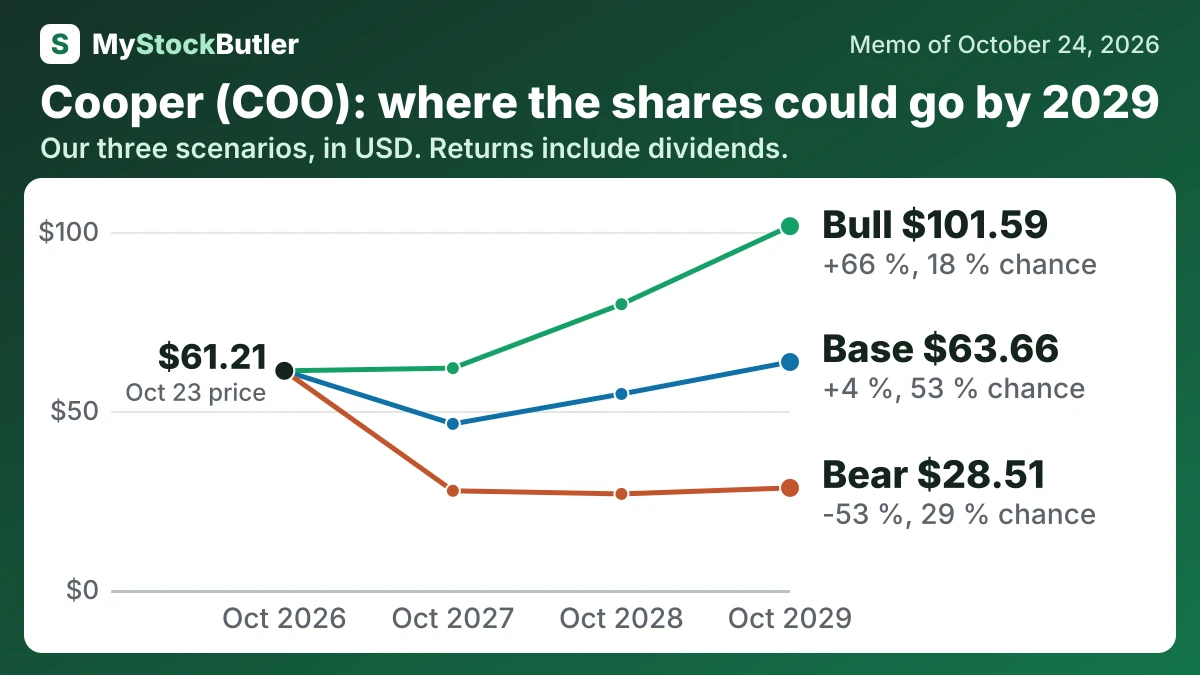
| Case | Probability | October 2027 | October 2028 | October 2029 |
|---|---|---|---|---|
| Bear | 29 % | 27.70 (-55 %) | 26.83 (-56 %) | 28.51 (-53 %) |
| Base | 53 % | 46.39 (-24 %) | 54.74 (-11 %) | 63.66 (+4 %) |
| Bull | 18 % | 61.96 (+1 %) | 79.80 (+30 %) | 101.59 (+66 %) |
| Weighted | 100 % | 43.77 (-28 %) | 51.16 (-16 %) | 60.30 (-1 %) |
What has to go right, and what could go wrong for Cooper?
The bear case gives earnings of $402 million in 2027 and $417 million in 2028, reaching $439 million in 2029. It assumes destocking persists, margins recover slowly and litigation and debt costs constrain cash. The bull case reaches $569 million in 2027 and $644 million in 2028, then $728 million in 2029, because launches, specialty adoption, factory economics and fertility services improve together.
| October 2027 | October 2028 | October 2029 | |
|---|---|---|---|
| Earnings | 509 (402 / 569) | 558 (417 / 644) | 605 (439 / 728) |
| Shares (millions) | 187 (189 / 184) | 184 (187 / 177) | 181 (185 / 172) |
| Dividends per share | 0.00 (0.00 / 0.00) | 0.00 (0.00 / 0.00) | 0.00 (0.00 / 0.00) |
| Price to earnings | 17.00 (13.00 / 20.00) | 18.00 (12.00 / 22.00) | 19.00 (12.00 / 24.00) |
How much cash does Cooper really make?
Working capital absorbed $284.8 million in fiscal 2025. Stock compensation adds another distinction: it is not a current cash wage payment, but it transfers value through shares. Deducting $70.5 million of stock pay leaves an analytical “real free cash flow” figure of $363.2 million.
| Oct 2025 | Oct 2024 | Oct 2023 | Oct 2022 | Oct 2021 | |
|---|---|---|---|---|---|
| Cash from operations | 796.1 | 709.3 | 607.5 | 692.4 | 738.6 |
| − Capital spending | 362.4 | 421.2 | 392.5 | 242.0 | 214.4 |
| = Free cash flow | 433.7 | 288.1 | 215.0 | 450.4 | 524.2 |
| − Stock pay | 70.5 | 75.1 | 62.1 | 54.2 | 43.8 |
| = Real free cash flow | 363.2 | 213.0 | 152.9 | 396.2 | 480.4 |
What this means. The company's own free cash flow matches ours, but our real free cash flow is lower because shares given to employees reduce each shareholder's ownership.
What does an investor pay for Cooper today?
A price-to-earnings ratio compares the share price with profit. Cooper’s reported profit needs cleaning up: July 2026 GAAP diluted EPS was $2.24, while adjusted EPS was $1.15. A $307.2 million tax benefit in the July 2026 quarter lifted GAAP profit, while $272.0 million of litigation expense weighed on the first nine months. Management’s forward guidance excludes amortization, impairment and other items, and does not reconcile to GAAP.