CBRE stock forecast 2027–2029
MyStockButler's October 2026 analysis: CBRE's weighted case is $154.31 in October 2029, an 18% gain including dividends. It hinges on the base case.
Where could CBRE's shares go?
The weighted price is $104.94 in October 2027, a 20% decline, and $154.31 in October 2029, an 18% gain including dividends. The cases assign 29% probability to bear, 51% to base and 20% to bull, with October 2029 outcomes from $83.65 to $254.87.
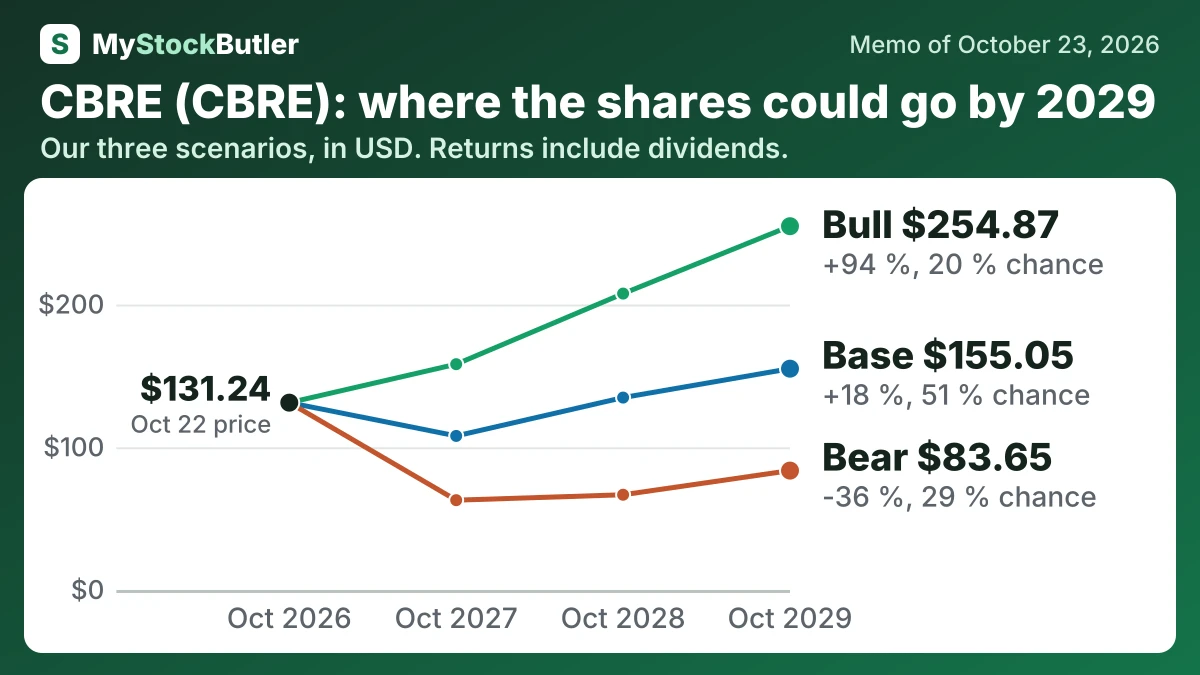
| Case | Probability | October 2027 | October 2028 | October 2029 |
|---|---|---|---|---|
| Bear | 29 % | 62.93 (-52 %) | 66.73 (-49 %) | 83.65 (-36 %) |
| Base | 51 % | 107.94 (-18 %) | 134.81 (+3 %) | 155.05 (+18 %) |
| Bull | 20 % | 158.20 (+21 %) | 207.66 (+58 %) | 254.87 (+94 %) |
| Weighted | 100 % | 104.94 (-20 %) | 129.63 (-1 %) | 154.31 (+18 %) |
What has to go right for CBRE's forecast?
The bear case starts at $1,900M and falls to $1,800M before recovering to $1,950M. Delayed property deals, weaker office leasing, rebids and labor pressure support that path. The bull case rises from $2,450M to $3,400M because infrastructure growth, a completed Onnec transaction and better fee conversion reinforce one another. Critical-infrastructure revenue grew 80% in the latest quarter, but the project default and account restructurings show why the higher outcome is not the base case.
| October 2027 | October 2028 | October 2029 | |
|---|---|---|---|
| Normal operating profit | 2,200 (1,900 / 2,450) | 2,450 (1,800 / 2,900) | 2,700 (1,950 / 3,400) |
| Shares (millions) | 283 (287 / 279) | 278 (286 / 272) | 274 (284 / 267) |
| Dividends per share | 0.00 (0.00 / 0.00) | 0.00 (0.00 / 0.00) | 0.00 (0.00 / 0.00) |
| Enterprise value to normal operating profit | 17.00 (13.00 / 21.00) | 18.00 (14.00 / 22.00) | 18.00 (15.00 / 22.00) |
| Net debt | 6,885 (6,633 / 7,281) | 6,597 (6,136 / 7,253) | 6,069 (5,476 / 6,801) |
How much cash does CBRE really make?
Across 2021–2025, operating cash flow totalled $7.7 billion and capital spending totalled $1.4 billion. That left conventional free cash flow of $6.3 billion across the period. In 2025, capital spending of $366 million left free cash flow of $1.2 billion before considering stock compensation.
Stock compensation was $120 million in 2025. It does not immediately use cash, but it transfers ownership to employees; repurchases needed to offset that dilution are an economic cost. CBRE’s own free-cash-flow measure was higher because it added property-disposition gains, which recognizes development economics but is not identical to freely distributable cash.
| 2025 | 2024 | 2023 | 2022 | 2021 | |
|---|---|---|---|---|---|
| Cash from operations | 1,559 | 1,708 | 480 | 1,629 | 2,364 |
| − Capital spending | 366 | 307 | 305 | 260 | 210 |
| = Free cash flow | 1,193 | 1,401 | 175 | 1,369 | 2,154 |
| − Stock pay | 120 | 146 | 96 | 160 | 185 |
| = Real free cash flow | 1,073 | 1,255 | 79 | 1,209 | 1,969 |
| Real free cash flow, % of revenue | 2.7% | 3.5% | 0.2% | 3.9% | 7.1% |
What this means. The company's own free cash flow is higher because it adds back items such as gains from selling real estate, while our count leaves them out.
What does an investor pay for CBRE today?
The current price implies about $4.67 of trailing earnings per share and about $8.93 on the next-twelve-month measure. If the definitions matched perfectly, investors would be pricing in roughly 91% earnings growth. They may not match, but the gap still identifies the central assumption behind the stock.