Ball earnings: next results and guidance
MyStockButler's October 2026 analysis: Ball reports its next results on November 3, 2026. Watch regional cans shipped alongside earnings and sales.
What has Ball guided for 2026?
Management reaffirmed at least 10.0% growth in comparable diluted earnings per share for the year ending December 2026. Comparable EPS is Ball’s adjusted profit per share after selected unusual items are removed. Diluted means the calculation includes shares that could be issued through employee awards, so the profit is spread over a larger potential share count. In the second quarter of 2026, Ball reported $1.03 of comparable diluted EPS but 83 cents of GAAP diluted EPS. The promise therefore concerns an adjusted measure, not necessarily statutory profit.
Management also targets a $900 million free-cash-flow floor and 2.7x year-end net debt to comparable EBITDA. The ratio compares borrowings after cash with adjusted operating earnings; lower debt relative to earnings generally leaves more room for investment and repayment.
| Period guided | Low | High | Date given | |
|---|---|---|---|---|
| Comparable diluted EPS growth (%) | Year to Dec 2026 | 10.0% | Aug 4, 2026 | |
| Free cash flow | Year to Dec 2026 | 900 | Aug 4, 2026 | |
| Effective tax rate on comparable earnings (%) | Year to Dec 2026 | 23.0% | Aug 4, 2026 | |
| Net debt to comparable EBITDA | At Dec 31, 2026 | 2.7x | 2.7x | Aug 4, 2026 |
| Share repurchases | Year to Dec 2026 | 600 | Aug 4, 2026 | |
| Capital expenditures for property, plant and equipment | Year to Dec 2026 | 600 | 600 | Aug 4, 2026 |
What this means. The company expects free cash flow to be more than 900 million dollars, so 900 is a floor rather than the exact minimum it promises.
Has Ball kept its past promises?
The average diluted share count fell in 2025, showing that repurchases more than offset stock-award dilution. That is useful, but the stronger test is whether cash generation and returns on factory investment improve alongside per-share results. Ball reaffirmed comparable earnings-per-share growth of 12–15% when Lewis took over in November 2025. The year ended with roughly 13% growth, to $3.57, though Lewis inherited most of that performance. By August 2026, management still expected more than 10% growth. That remained a promise rather than a completed result.
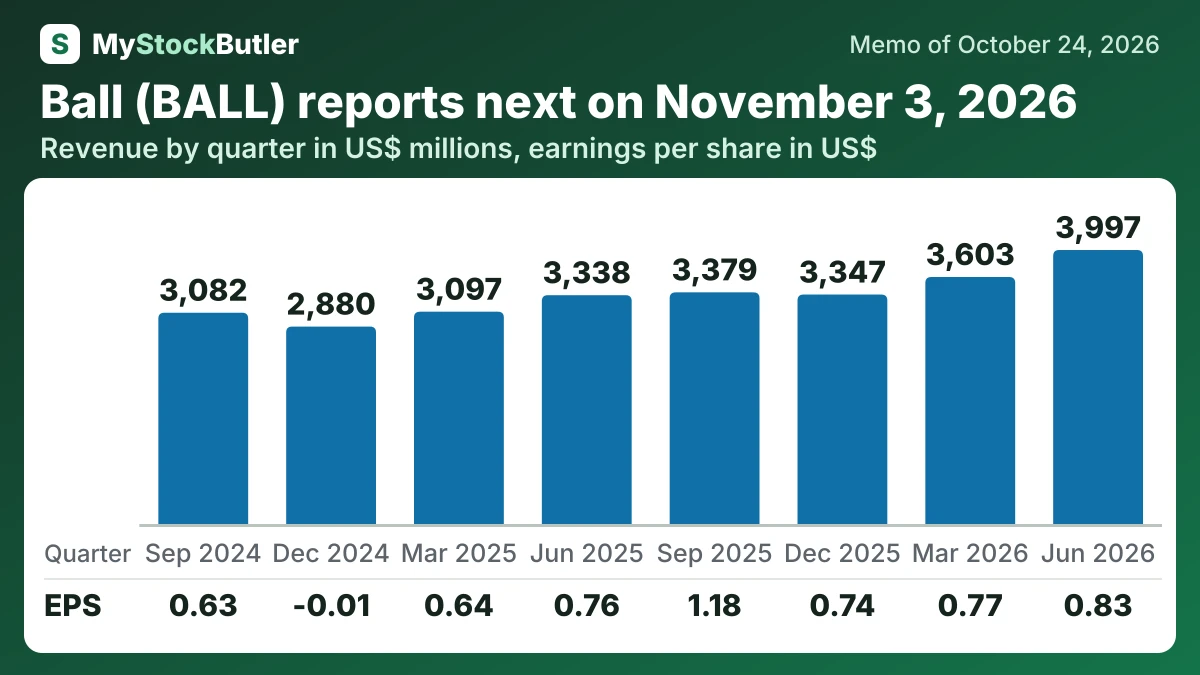
What have Ball's last eight quarters shown?
Operating income rose from $344 million to $347 million. Gross margin fell from 19.4% to 17.4%. Diluted EPS rose from $0.76 to $0.83, again showing the help from a smaller share count.
| Jun 2026 | Mar 2026 | Dec 2025 | Sep 2025 | Jun 2025 | Mar 2025 | Dec 2024 | Sep 2024 | |
|---|---|---|---|---|---|---|---|---|
| Revenue | 3,997 | 3,603 | 3,347 | 3,379 | 3,338 | 3,097 | 2,880 | 3,082 |
| Gross margin | 17.4% | 17.9% | 19.4% | 20.1% | 19.4% | 19.5% | 20.5% | 21.3% |
| Operating income | 347 | 326 | 327 | 468 | 344 | 292 | 62 | 280 |
| Net income | 221 | 205 | 197 | 322 | 212 | 181 | -3 | 191 |
| EPS, diluted | 0.83 | 0.77 | 0.74 | 1.18 | 0.76 | 0.64 | -0.01 | 0.63 |
| = Free cash flow | 467 | -938 | 1,041 | 257 | 236 | -746 | 393 | 493 |
What this means. The company can report a profit while free cash flow is negative because profit is not the same as cash received and paid out.
What should I watch in Ball's next results?
The nearest checkpoint is November 3, 2026, when Ball reports its September quarter. Watch regional cans shipped alongside earnings and sales. Higher aluminum prices can raise revenue without increasing the number of cans sold. Management said North America and EMEA were broadly tracking their markets, while South America was outperforming a relatively flat market. Ardagh Metal Packaging reported that its own Brazil shipments fell 15% in the second quarter of 2026; that figure does not measure the Brazilian market’s shipment growth.