Aptiv earnings: November 3, 2026 results
MyStockButler's October 2026 analysis: Aptiv’s next results are expected on November 3, 2026. Watch Aptiv’s cash recovery against the annual free-cash-flow plan.
What has Aptiv guided for the year?
On August 4, management guided 2026 sales of $12.6–$12.8 billion, adjusted earnings per share of $5.60–$5.80 and free cash flow of $625–$725 million. Adjusted earnings exclude specified accounting charges; free cash flow is the cash left after capital spending.
| Period guided | Low | High | Date given | |
|---|---|---|---|---|
| Net sales | Full Year 2026 | 12,600 | 12,800 | Aug 4, 2026 |
| Net sales | Q3 2026 | 3,120 | 3,220 | Aug 4, 2026 |
| Adjusted EBITDA | Full Year 2026 | 2,310 | 2,370 | Aug 4, 2026 |
| Adjusted EBITDA | Q3 2026 | 545 | 575 | Aug 4, 2026 |
| U.S. GAAP diluted net income per share from continuing operations | Full Year 2026 | 4.06 | 4.26 | Aug 4, 2026 |
| U.S. GAAP diluted net income per share from continuing operations | Q3 2026 | 0.86 | 0.96 | Aug 4, 2026 |
| Adjusted net income per share | Full Year 2026 | 5.60 | 5.80 | Aug 4, 2026 |
| Adjusted net income per share | Q3 2026 | 1.25 | 1.35 | Aug 4, 2026 |
| Free cash flow | Full Year 2026 | 625 | 725 | Aug 4, 2026 |
What this means. The company’s adjusted profit measures leave out selected costs, so they can look better than profit reported under standard accounting rules.
Has Aptiv kept its past promises?
Aptiv has met or exceeded eight of fifteen initial annual targets, a promises-kept score of 2/5. Adjusted EPS beat the initial ceiling from 2023 through 2025, but sales and cash targets missed in other years. Repeated explanations—from pandemic disruption to customer schedule reductions—make forecasting discipline part of the test.
| What management forecast | Checked | Above | Within | Below |
|---|---|---|---|---|
| Net sales | 5 years | 1 | 2 | 2 |
| Adjusted net income per share | 5 years | 3 | 0 | 2 |
| Cash flow from operations | 5 years | 2 | 0 | 3 |
What is Aptiv’s recent revenue and profit trend?
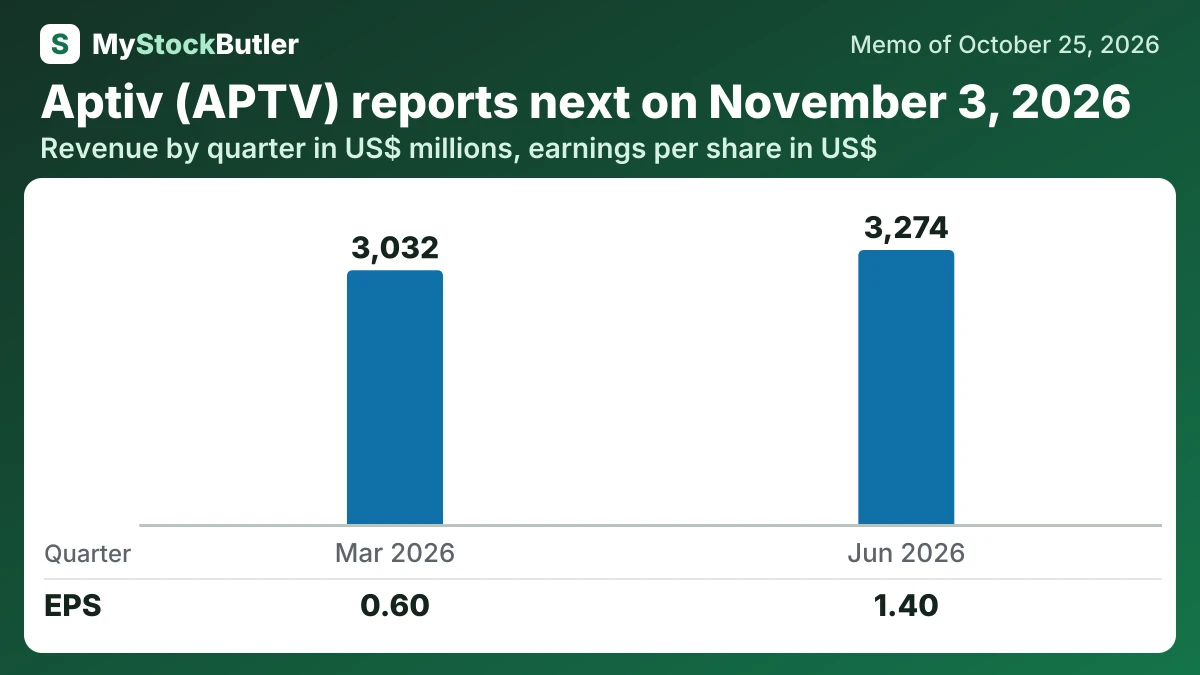
Revenue rose 2.3% to $3,274 million against June 2025. Gross margin improved from 22.9% to 23.7%, while operating income rose 12.9% to $367 million. Aptiv therefore earned more from each sales dollar.
| Jun 2026 | Mar 2026 | Jun 2025 | Mar 2025 | |
|---|---|---|---|---|
| Revenue | 3,274 | 3,032 | 3,199 | 2,987 |
| Gross margin | 23.7% | 22.1% | 22.9% | 22.5% |
| Operating income | 367 | 274 | 325 | 289 |
| Net income | 298 | 129 | 265 | -140 |
| EPS, diluted | 1.40 | 0.60 | 1.21 | -0.61 |
What should I watch in Aptiv’s next results?
Investors should listen for customer production schedules in China, the pace of delayed launches and the timing of software contracts. A launch announcement does not establish production volume, so the key issue is how quickly programs are ramping and whether postponed enterprise sales are moving into later periods.
Cash deserves equal attention. Aptiv must compare cash generated in the second half with the $821 million required to reach the annual free-cash-flow floor. Separation-related transaction costs may produce tax refunds, but those receipts should be distinguished from cash earned through ongoing operations. Investors should also watch whether buybacks continue while the annual cash target remains intact.