Align stock forecast 2027–2029
MyStockButler's November 2026 analysis: The probability-weighted price is $193.87 in November 2027, including dividends, for a 29% return from today’s $149.89. It hinges on whether rising case volume stops being offset by falling revenue per case.
Where could Align’s shares be by November 2029?
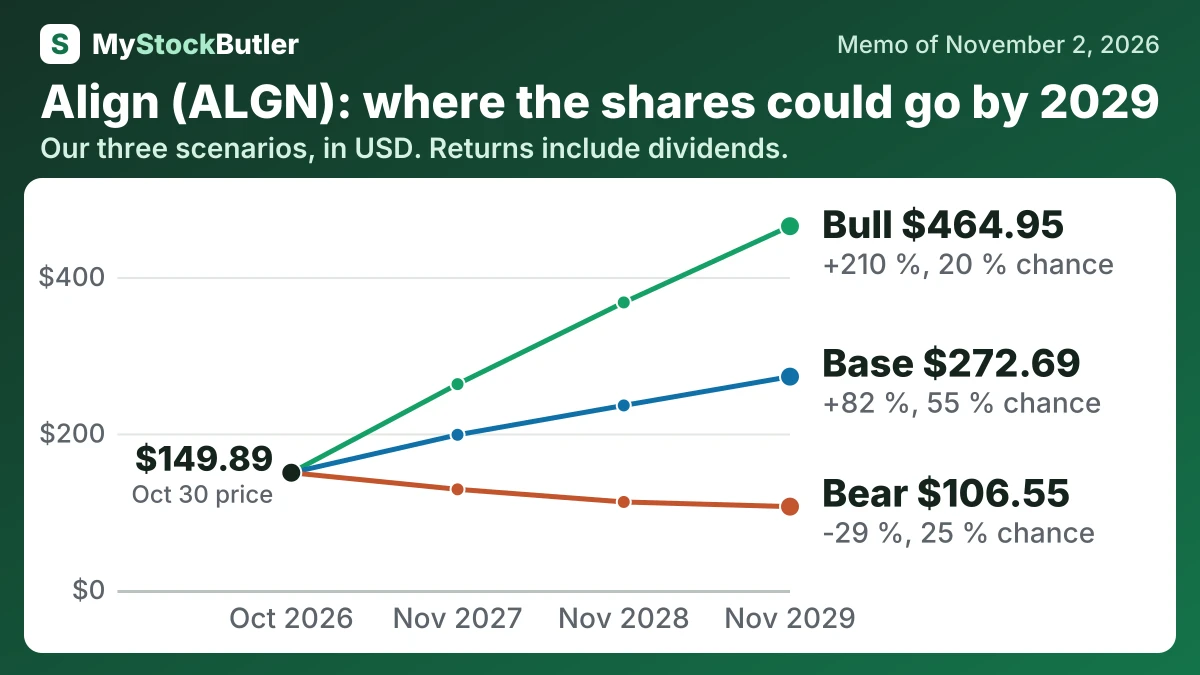
The forecast points to a recovery in Align Technology’s share price, but with meaningful downside if pricing and execution remain weak. The probability-weighted price is $193.87 in November 2027, including dividends, for a 29% return from today’s $149.89. It rises to $231.36 in November 2028, a 54% return, and $269.61 in November 2029, an 80% return.
| Case | Probability | November 2027 | November 2028 | November 2029 |
|---|---|---|---|---|
| Bear | 25 % | 128.64 (-14 %) | 112.50 (-25 %) | 106.55 (-29 %) |
| Base | 55 % | 198.35 (+32 %) | 235.88 (+57 %) | 272.69 (+82 %) |
| Bull | 20 % | 263.10 (+76 %) | 367.50 (+145 %) | 464.95 (+210 %) |
| Weighted | 100 % | 193.87 (+29 %) | 231.36 (+54 %) | 269.61 (+80 %) |
What has to go right or wrong for Align?
The bear case uses revenue of $4.15 billion, $4.2 billion, and $4.25 billion, with margins of 12.8%, 12.5%, and 12.5%. Earnings therefore remain near $531 million because 2025 case growth of 4.7% produced only 0.5% clear-aligner revenue growth. The bull case uses revenue of $4.45 billion, $4.9 billion, and $5.4 billion, with margins rising from 16.2% to 19%. It requires stronger patient starts, stable pricing, productive scanners, and sustained efficiency gains; utilization and teen-and-kids starts provide support, but not proof of that outcome.
How much cash does Align really make?
Cash from operations was $593.223 million in 2025. After $102.445 million of capital spending, free cash flow was $490.778 million, down from $622.651 million in 2024. That spending includes both growth and upkeep, so the accounts do not show how much was needed merely to maintain the business.
Stock compensation was $185.870 million. Subtracting it from free cash flow produces an analytical allowance for the economic cost of issuing shares and possible dilution; it is not a second cash payment. The table follows that bridge.
| 2025 | 2024 | 2023 | 2022 | 2021 | |
|---|---|---|---|---|---|
| Cash from operations | 593,223 | 738,231 | 785,776 | 568,732 | 1,172,544 |
| − Capital spending | 102,445 | 115,580 | 177,716 | 291,900 | 401,098 |
| = Free cash flow | 490,778 | 622,651 | 608,060 | 276,832 | 771,446 |
| − Stock pay | 185,870 | 173,703 | 154,026 | 133,367 | 114,336 |
| = Real free cash flow | 304,908 | 448,948 | 454,034 | 143,465 | 657,110 |
What this means. The company's own free cash flow is almost the same as ours because the small gap comes only from rounding, but our real free cash flow is lower because we subtract shares given to employees as pay.
What does an investor pay for Align today?
Market value is what all the company’s shares are worth. The price-to-earnings ratio, or P/E, compares that value with annual profit per share. It tells investors how much they pay for each dollar of recent earnings, so the important question is whether Align can sustain both case demand and profit per case.
| Today (Nov 2, 2026) | |
|---|---|
| Share price | 149.89 |
| Market value (calculated) | 10,648,163.41628 |
| Enterprise value (calculated) | 9,503,232.41628 |
| P/E, last 12 months (calculated) | 21.8x |
| P/E, next 12 months (calculated) | 13.5x |
| Real free cash flow yield (calculated) | 2.9% |
What this means. The next 12 months price-to-earnings figure uses analysts’ forecast profit, so it is an estimate and may be wrong.