TTI earnings: guidance, results and what to watch
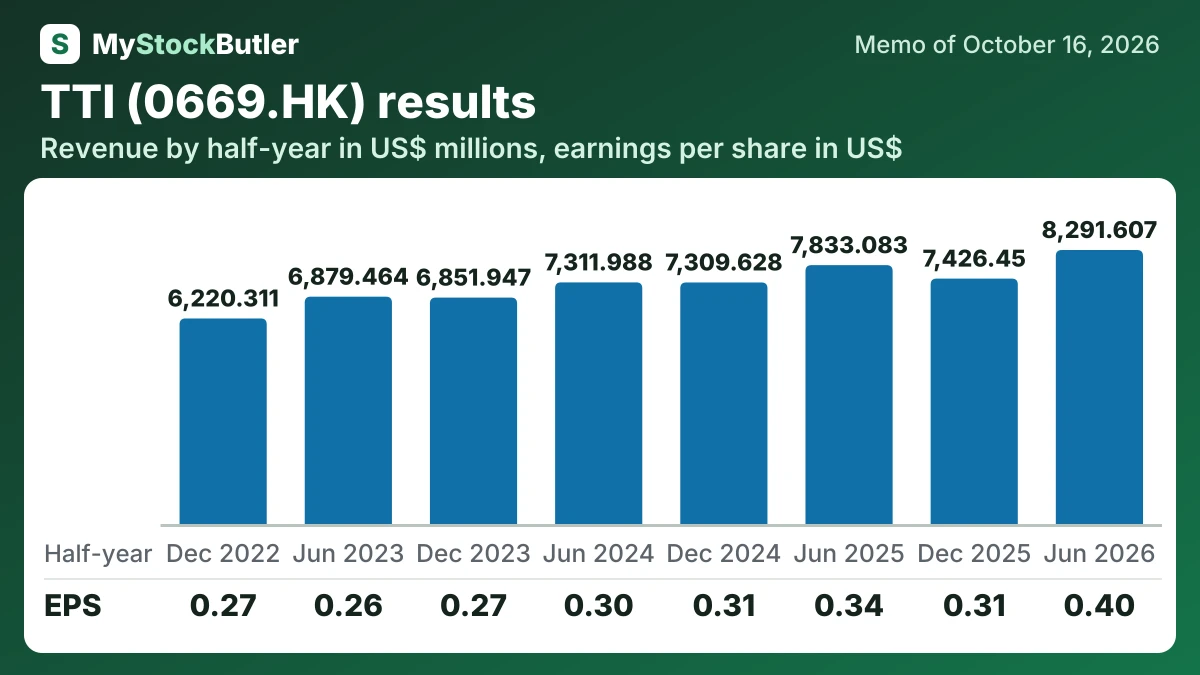
MyStockButler's October 2026 analysis: The latest reported results show revenue of US$8,291.607 million and net income of US$738.407 million, up from US$7,833.083 million and US$628.339 million a year earlier. Watch whether cash generation exceeded the raised target and whether second-half profitability supports the 2027 margin ambition.
What has TTI guided for the year?
On August 4, 2026, management raised its internal annual free-cash-flow target to above US$1,300 million and expressed greater confidence in reaching a 10.0% EBIT margin in 2027. Free cash flow is operating cash left after TTI’s specified investment deductions. EBIT means operating profit before interest and tax, so an EBIT margin shows how much operating profit remains from each dollar of sales. First-half 2026 EBIT reached US$822 million, with a 9.9% margin, but one strong half-year does not prove a full-year result.
The share-repurchase plan adds another claim on cash. TTI may spend up to US$500 million between June 2026 and November 2027 buying its own shares; about US$42 million had been spent by the end of July 2026. Repurchases can lift earnings per share by reducing the share count, but they leave less cash for factories, debt, or dividends. The combined promises now lead to the funding question.
| Period | Low | High | Given on | |
|---|---|---|---|---|
| EBIT margin (internal target) | 2027 | 10.0% | Aug 4, 2026 | |
| Free cash flow (internal target, US$ millions) | 2026 | 1,300 | Aug 4, 2026 | |
| Automatic share repurchase plan (US$ millions) | Jun 2026–Nov 2027 | 500 | Aug 4, 2026 | |
| Annual sales growth — MILWAUKEE (internal target, US$ millions) | 2026–2027 | 1,000 | Aug 4, 2026 |
What this means. The automatic share repurchase plan is a maximum of 500 million United States dollars, not money the company has promised to spend.
Did TTI keep its past promises?
Management’s operating record is mixed. TTI expected mid-to-high-single-digit group sales growth for 2025, but reported growth was 4.4%. It kept working capital, meaning cash tied up in inventory and customer balances after supplier credit, at 15.5% of sales, within its promised range.
What is TTI's revenue and profit trend?
Revenue was US$8,291.607 million, against US$7,833.083 million a year earlier. Net income rose to US$738.407 million from US$628.339 million. Because outdoor demand and retailer ordering are seasonal, the right comparison is first half against first half.
| 6 months to Jun 2026 | 6 months to Dec 2025 | 6 months to Jun 2025 | 6 months to Dec 2024 | 6 months to Jun 2024 | 6 months to Dec 2023 | 6 months to Jun 2023 | 6 months to Dec 2022 | |
|---|---|---|---|---|---|---|---|---|
| Revenue | 8,291.607 | 7,426.45 | 7,833.083 | 7,309.628 | 7,311.988 | 6,851.947 | 6,879.464 | 6,220.311 |
| Gross margin | 42.9% | 42.2% | 40.3% | 40.7% | 39.9% | 39.7% | 39.3% | 39.6% |
| Net income | 738.407 | 569.955 | 628.339 | 571.315 | 550.365 | 500.561 | 475.779 | 499.162 |
| EPS, diluted | 0.40 | 0.31 | 0.34 | 0.31 | 0.30 | 0.27 | 0.26 | 0.27 |
| Cash from operations | 984.566 | 1,260.073 | 719.108 | 1,492.73 | 774.916 | 1,410.101 | 693.774 | 1,172.738 |
| = Free cash flow | 667.322 | 841.877 | 385.617 | 995.346 | 421.872 | 850.509 | 219.286 | 525.763 |
What this means. Free cash flow is lower than cash from operations because we subtract spending on equipment and lease payments; interest paid is shown as zero because it was already included.
What should I watch in TTI's next release?
The first checkpoint is the full-year 2026 result for the year ending December 31, 2026. It should show whether cash generation exceeded the raised target and whether second-half profitability supports the 2027 margin ambition. A strong first half can still be followed by a weaker second half, so the annual result matters more than the interim snapshot.