SHKP earnings: results, guidance and what to watch
MyStockButler's October 2026 analysis: SHKP’s latest half-year had higher revenue but lower operating income, net income and diluted EPS, with gross margin at 38.8%. SHKP’s next release should show whether planned residential launches occur and Stage IGC’s initial shops open.
What has SHKP guided for FY2027?
Contracted sales are signed customer commitments, not necessarily revenue. SHKP targets HK$33 billion of new Hong Kong contracted sales and HK$2.5 billion on the Mainland in FY2027. Separately, it expects to recognize HK$21 billion of earlier Hong Kong sales and HK$800 million of Mainland sales. The first pair measures new business won; the second measures homes reaching delivery.
The FY2027 Hong Kong completion schedule totals 2,850,000 attributable square feet across homes and commercial properties. Planned launches include SIERRA SEA Phase 2C and Tung Shing Lei Phase 1A by the end of 2026, followed by projects in Tai Wai, Kwu Tung and near City One Station. Approvals remain a dependency because construction can advance before a project is allowed to launch.
| Period | Low | High | Given on | |
|---|---|---|---|---|
| Contracted sales expected to be recognized in Hong Kong (approximately) | Year to Jun 2027 | 21,000 | 21,000 | Sep 10, 2026 |
| Contracted sales expected to be recognized on the Chinese Mainland (approximately) | Year to Jun 2027 | 800 | 800 | Sep 10, 2026 |
| Land resumption compensation to be recognized (approximately) | Year to Jun 2027 | 2,200 | 2,200 | Sep 10, 2026 |
| Expected revenue from remaining performance obligations recognized within one year (%) | Year to Jun 2027 | 92.0% | 92.0% | Sep 10, 2026 |
| Scheduled for completion in FY2026/27 – Hong Kong, Year total (attributable square feet) | Year to Jun 2027 | 2,850,000 | 2,850,000 | Oct 8, 2026 |
| Scheduled for completion in FY2026/27 – Chinese Mainland, Year total (attributable square feet) | Year to Jun 2027 | 4,832,000 | 4,832,000 | Oct 8, 2026 |
What this means. The contracted sales figures are sales already agreed that the company expects to record as revenue, not new sales it expects to make.
Has SHKP kept its past promises?
Contracted sales show strong execution, but they are not the same as profit. Contracted sales are signed commitments from buyers, while the company still faces construction, financing and land costs. SHKP achieved approximately HK$42.3 billion against a FY2025 target of HK$25 billion. Its FY2026 presentation reported approximately HK$38.1 billion against a target of HK$30.0 billion. The proposed full-year FY2026 dividend was HK$3.91 per share.
What has SHKP’s revenue and profit trend been over the last eight reported periods?
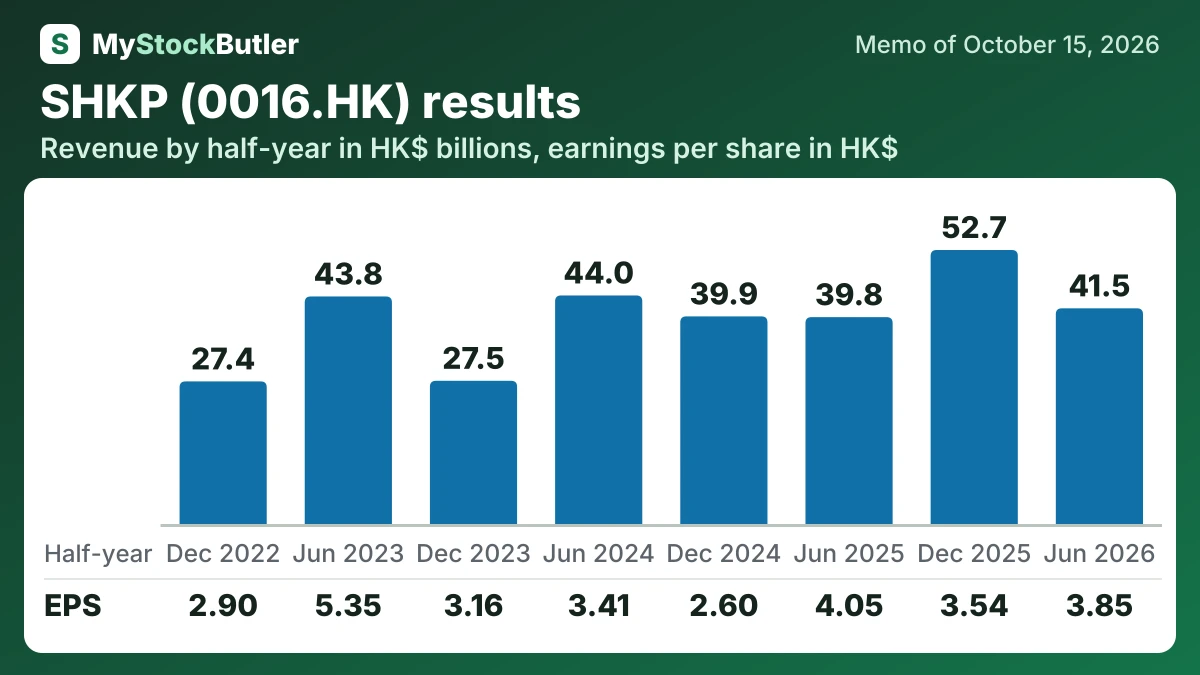
Revenue increased year on year, while operating income, net income and diluted EPS declined. Gross margin was 38.8%, below 46.9% in the comparable half-year, although it improved from 30.4% in the preceding six months. That pattern reflects development mix and handover timing rather than a broad recovery in profitability.
The eight-period record shows why half-year comparisons matter. Earlier years were weighted toward June-period sales, while 2026 recognized more revenue in its December half. Operating cash flow was even less regular, with a negative December 2023 period followed by a large positive June period.
| 6 months to Jun 2026 | 6 months to Dec 2025 | 6 months to Jun 2025 | 6 months to Dec 2024 | 6 months to Jun 2024 | 6 months to Dec 2023 | 6 months to Jun 2023 | 6 months to Dec 2022 | |
|---|---|---|---|---|---|---|---|---|
| Revenue | 41,489 | 52,705 | 39,788 | 39,933 | 43,964 | 27,542 | 43,767 | 27,428 |
| Gross margin | 38.8% | 30.4% | 46.9% | 38.9% | 41.8% | 50.2% | 46.6% | 51.2% |
| Operating income | 11,746 | 13,398 | 13,980 | 12,098 | 15,799 | 10,953 | 16,686 | 10,859 |
| Net income | 11,179 | 10,247 | 11,754 | 7,523 | 9,901 | 9,145 | 15,497 | 8,410 |
| EPS, diluted | 3.85 | 3.54 | 4.05 | 2.60 | 3.41 | 3.16 | 5.35 | 2.90 |
What this means. The half-year free cash flow figures leave out some cash spent on equipment and licenses, so they may look higher than the company’s true free cash flow.