Power Assets dividend
MyStockButler's October 2026 analysis: Power Assets pays HK$2.82 per share, and its dividend has stayed there across the five-year record. In 2025, dividends of HK$6,010 million exceeded FFO of HK$5,314 million, so cash coverage was short by HK$696 million.
How much does Power Assets pay per share?
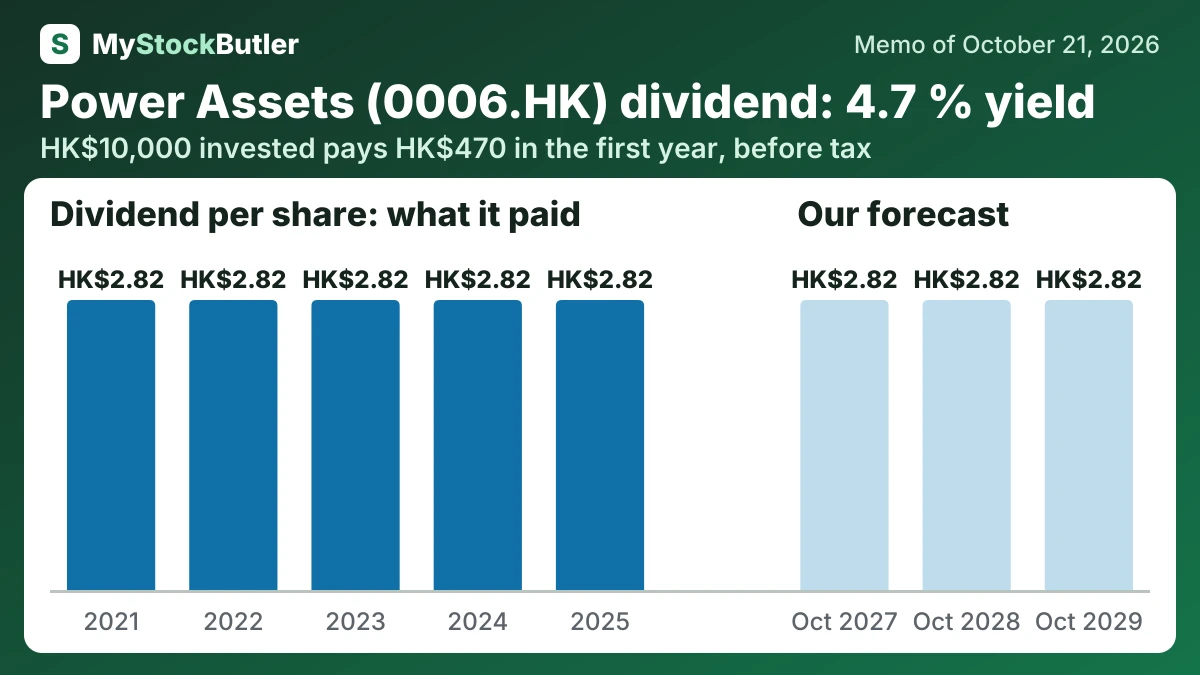
The base dividend stays at HK$2.82 per share throughout, matching the five-year record and all broker expectations for 2027. The bear case keeps it at HK$2.82 initially, then cuts it to HK$2.40 and HK$2.00 as weak receipts persist. The bull case reaches HK$2.90 and HK$3.00 after 2027 if reinvestment and AVR recovery improve cash coverage. The restraint in the base case reflects 2025 FFO of HK$5,314 million against HK$6,010 million of dividends.
| 2025 | 2024 | 2023 | 2022 | 2021 | |
|---|---|---|---|---|---|
| Revenue | 771 | 919 | 1,292 | 1,265 | 1,276 |
| Net income | 6,236 | 6,119 | 6,003 | 5,649 | 6,140 |
| EPS, diluted | 2.93 | 2.87 | 2.82 | 2.65 | 2.88 |
| Dividend per share | 2.82 | 2.82 | 2.82 | 2.82 | 2.82 |
How much would Power Assets's dividend pay you?
HK$10,000 invested in Power Assets at its 4.7% dividend yield (our report of October 21, 2026) pays HK$470.00 in the first year, before tax. If its dividend per share keeps changing 0.0% a year, as it did from 2021 to 2025, and the dividends are reinvested, year 10 pays HK$710.59, with HK$5,829.49 received in all.
Before tax. Past dividend growth is not a promise. Information only, not investment advice.
Does Power Assets' cash cover its dividend?
The dividend test was tighter than the earnings test. The 2025 dividend was HK$2.82 per share. It required approximately HK$6,010 million, about HK$696 million more than 2025 FFO. One gap is not proof of distress, but repeated gaps need a durable funding source.
From 2021 through 2025, Power Assets put far more cash into dividends than into new acquisitions or buybacks. The company did not sell new shares during the period, and its only buyback was small enough to reduce the share count by approximately 0.15 per cent.
| 2025 | 2024 | 2023 | 2022 | 2021 | |
|---|---|---|---|---|---|
| − Dividends paid | 6,010 | 6,010 | 6,009 | 6,019 | 6,019 |
| − Share buybacks | 0 | 0 | 0 | 121 | 0 |
| New shares sold | 0 | 0 | 0 | 0 | 0 |
| Acquisitions | 16 | 782 | 638 | 266 | 444 |
What this means. The acquisitions row also includes investments in joint ventures and associates, not only cash used to buy whole businesses.
What could change Power Assets' dividend?
The forecast would move toward the bear case if replacement income remains delayed through 2027, FFO coverage deteriorates or the dividend is cut by 2028 or 2029. Currency weakness and higher refinancing costs would add pressure.
| October 2027 | October 2028 | October 2029 | |
|---|---|---|---|
| Net asset value | 103,954 (102,050 / 105,023) | 104,572 (101,240 / 106,443) | 105,190 (100,430 / 107,863) |
| Shares (millions) | 2,131 (2,131 / 2,131) | 2,131 (2,131 / 2,131) | 2,131 (2,131 / 2,131) |
| Dividends per share | 2.82 (2.82 / 2.82) | 2.82 (2.40 / 2.90) | 2.82 (2.00 / 3.00) |
| Price to net asset value | 1.15 (0.95 / 1.25) | 1.15 (0.85 / 1.30) | 1.15 (0.75 / 1.35) |
What is Power Assets' dividend yield against its share price?
The forward P/E says how much investors pay for a year of forecast profit. The dividend yield is more tangible: it shows the cash return shareholders receive if the dividend is maintained. But profit and cash are different events. Power Assets can record its share of a joint venture’s earnings before that business distributes any money.