Power Assets stock forecast 2027–2029
MyStockButler's October 2026 analysis: Power Assets' weighted scenario is HK$54.33 in October 2027, with a 6% loss with dividends. Power Assets' outlook hinges on stable post-UKPN earnings, cash reaching the parent and productive reinvestment.
Where could Power Assets' shares be by 2029?
The weighted price is HK$54.33 in October 2027, a 6% loss with dividends. It is HK$53.28 in October 2029, a 2% gain with dividends. The bear case has 26% probability, and the base case 56%. The bull case has 18%.
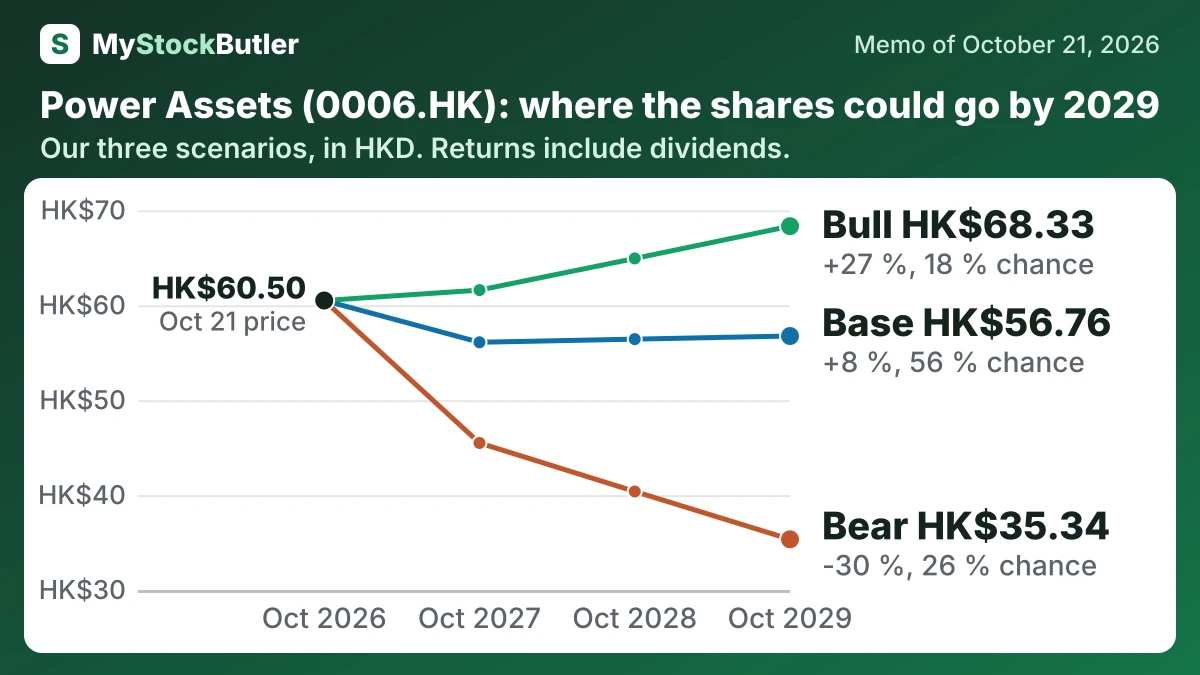
| Case | Probability | October 2027 | October 2028 | October 2029 |
|---|---|---|---|---|
| Bear | 26 % | 45.49 (-20 %) | 40.38 (-25 %) | 35.34 (-30 %) |
| Base | 56 % | 56.10 (-3 %) | 56.43 (+3 %) | 56.76 (+8 %) |
| Bull | 18 % | 61.60 (+6 %) | 64.93 (+17 %) | 68.33 (+27 %) |
| Weighted | 100 % | 54.33 (-6 %) | 53.79 (-2 %) | 53.28 (+2 %) |
What has to go right or wrong for Power Assets?
The bear case requires UKPN replacement income to arrive slowly and FFO to remain below distributions. Currency weakness, refinancing costs or investee spending then deepen the cash shortfall, making a dividend cut and lower valuation reinforce each other. The price falls from HK$45.49 at the first date to HK$35.34 at the last, with a 26% probability. That probability reflects the 2025 coverage gap, but substantial liquidity and the stable dividend record make a severe path less likely.
The bull case requires productive reinvestment, timely projects, stronger investee distributions and AVR electricity-generation recovery. FFO rises above dividends, allowing both DPS and the multiple to improve. The price rises from HK$61.60 to HK$68.33, with an 18% probability because several uncertain events must succeed together.
How much cash does Power Assets really make?
The dividend test was tighter than the earnings test. The 2025 dividend was HK$2.82 per share. It required approximately HK$6,010 million, about HK$696 million more than 2025 FFO. One gap is not proof of distress, but repeated gaps need a durable funding source.
| 2025 | 2024 | 2023 | 2022 | 2021 | |
|---|---|---|---|---|---|
| Funds from operations | 5,314 | 4,901 | 5,277 | 5,528 | 5,300 |
| Operating profit | 540 | 666 | 1,131 | 1,164 | 1,501 |
What this means. Operating profit is not profit after tax because it is measured before borrowing costs, some investment results, and tax.
What does an investor pay today for Power Assets?
The forward P/E says how much investors pay for a year of forecast profit. The dividend yield is more tangible: it shows the cash return shareholders receive if the dividend is maintained. But profit and cash are different events. Power Assets can record its share of a joint venture’s earnings before that business distributes any money.
| Today (Oct 21, 2026) | |
|---|---|
| Share price | 60.50 |
| Market value (every class) (calculated) | 128,931.86 |
| Price to book (calculated) | 1.3x |
| P/E, next 12 months (calculated) | 19.4x |
| Dividend yield (calculated) | 4.7% |
What this means. The dividend yield adds the two different payments from the last financial year to estimate what a full year's dividend would be compared with today's share price.