Wabtec stock forecast 2027–2029
MyStockButler's October 2026 analysis: Wabtec’s weighted case is broadly flat through October 2029, with a weighted price of $273.98 and a total return of 2% including dividends. It hinges on profitable backlog conversion, durable margins and earnings turning into cash.
Where could Wabtec's shares be by October 2029?
Wabtec’s probability-weighted outcome is broadly flat, but the range of possible outcomes is wide. The reference price is $272.35. The weighted price is $264.25 in October 2027, a total return of -2% including dividends. It reaches $269.49 in October 2028, implying a return of 0%. By October 2029, the weighted price is $273.98, implying a return of 2%.
The bear-to-bull range in October 2029 is $142.80 to $448.17. The forecast assigns 27% to the bear case, 55% to the base case and 18% to the bull case.
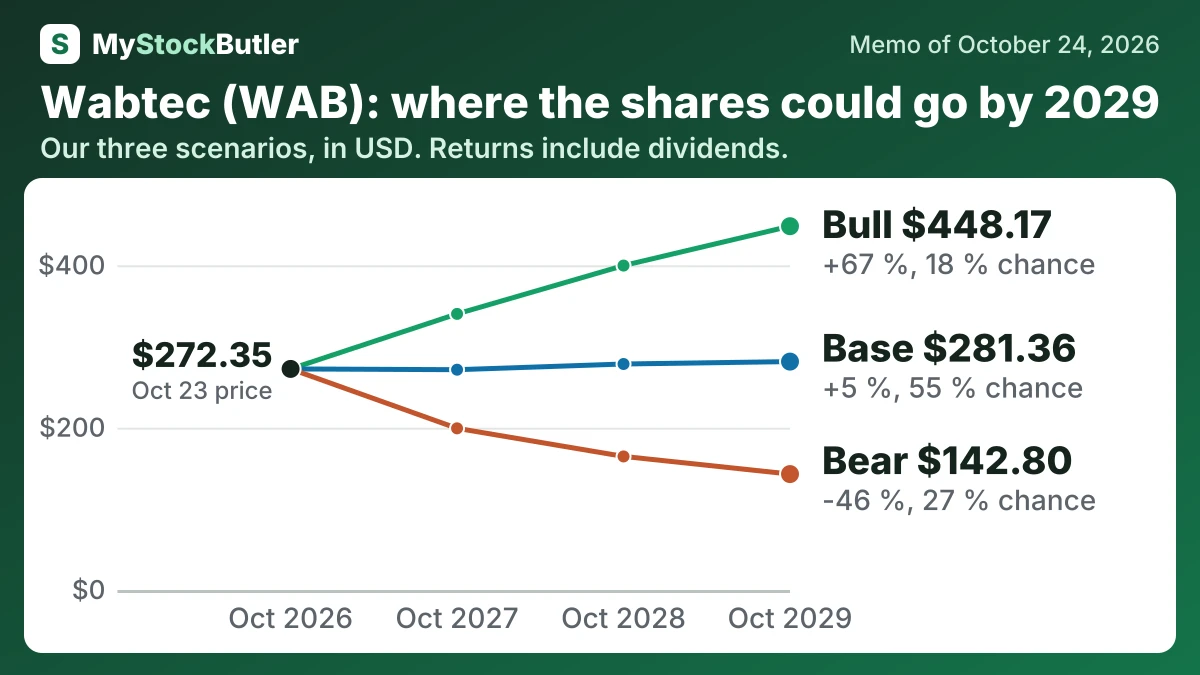
| Case | Probability | October 2027 | October 2028 | October 2029 |
|---|---|---|---|---|
| Bear | 27 % | 199.15 (-26 %) | 164.54 (-39 %) | 142.80 (-46 %) |
| Base | 55 % | 271.38 (+0 %) | 278.41 (+3 %) | 281.36 (+5 %) |
| Bull | 18 % | 340.14 (+25 %) | 399.67 (+48 %) | 448.17 (+67 %) |
| Weighted | 100 % | 264.25 (-2 %) | 269.49 (+0 %) | 273.98 (+2 %) |
What this means. The weighted value is the probability-based average of the bear, base, and bull cases, not a separate prediction.
What has to go right for Wabtec, and what could go wrong?
The base case assumes revenue of $13,100 million in 2027 and $13,820 million in 2028. It reaches $14,580 million in 2029, while normalized net margin rises from 11.5% to 12.2%. That produces earnings of $1,506 million in 2027, $1,645 million in 2028 and $1,779 million in 2029. The bear case slows revenue and reduces margin as freight spending, acceptances and transit projects weaken. The bull case assumes backlog conversion, aftermarket growth and productivity raise earnings to $2,012 million by 2029. The $31.435 billion backlog supports the upside, but only $8.992 billion is scheduled within twelve months.
How much cash does Wabtec really make?
The annual pattern is also uneven. In 2025, working capital released only $4 million, after releasing $177 million in 2024, even though earnings increased. Free cash flow means operating cash left after capital spending. Deducting $80 million of stock compensation produces a more owner-oriented measure, because equity granted to employees ultimately reduces existing shareholders’ economic claim.
| 2025 | 2024 | 2023 | 2022 | 2021 | |
|---|---|---|---|---|---|
| = Free cash flow | 1,499 | 1,627 | 1,015 | 889 | 943 |
| − Stock pay | 80 | 66 | 47 | 41 | 46 |
| = Real free cash flow | 1,419 | 1,561 | 968 | 848 | 897 |
| Free cash flow, % of revenue | 13.4% | 15.7% | 10.5% | 10.6% | 12.1% |
| Real free cash flow, % of revenue | 12.7% | 15.0% | 10.0% | 10.1% | 11.5% |
What this means. Stock pay is subtracted even though it uses no cash because giving employees shares reduces existing shareholders’ ownership.
What does an investor pay for Wabtec today?
P/E means the price paid for each dollar of earnings. Wabtec’s trailing P/E was 33.8x and its forward P/E was 24.8x. The forward multiple implies about $10.98 of earnings per share, close to the midpoint of the company’s 2026 adjusted guidance. But adjusted earnings exclude selected costs, while GAAP is the standard accounting result, and Wabtec supplied no reliable bridge from its guidance to GAAP earnings.
| Today (Oct 24, 2026) | |
|---|---|
| Share price | 272.35 |
| Market value (calculated) | 45,700.98 |
| Enterprise value (calculated) | 51,601.98 |
| P/E, last 12 months (calculated) | 33.8x |
| P/E, next 12 months (calculated) | 24.8x |
| Free cash flow yield (calculated) | 3.3% |
What this means. Enterprise value is the cost of buying the whole business, including its debt but subtracting its cash.