Veralto earnings date and guidance
MyStockButler's October 2026 analysis: Veralto's next results are expected on October 29, 2026. Watch Veralto's packaging demand recovery and whether it produces sales, margins and cash.
What has Veralto guided for 2026?
Management expects adjusted earnings per share of $4.35–$4.43, representing 12%–14% earnings growth. Adjusted earnings exclude specified costs from reported accounting earnings, so they help compare operating performance but do not replace the ordinary result. Full-year sales growth is higher, at 7.0%–7.5%, because acquisitions and currency add to core growth.
The immediate test is the third quarter. Management expects 4.0%–5.0% core sales growth and adjusted earnings per share of $1.06–$1.09. It also expects 25 basis points of adjusted operating-margin expansion. Operating margin is the share of sales left after operating costs; a basis point is one hundredth of a percentage point. The full-year targets are 25–50 basis points of margin expansion and 100.0% free-cash-flow conversion, meaning cash left after capital expenditure should equal reported net earnings.
| Period | Low | High | Date given | |
|---|---|---|---|---|
| Core sales growth (non-GAAP), full year | Year to Dec 2026 | 4.0% | 4.5% | Jul 28, 2026 |
| Adjusted Operating Profit Margin (non-GAAP), full-year expansion (basis points) | Year to Dec 2026 | 25 | 50 | Jul 28, 2026 |
| Adjusted Diluted Net Earnings per Share (non-GAAP), full year | Year to Dec 2026 | 4.35 | 4.43 | Jul 28, 2026 |
| Free cash flow to net earnings conversion ratio (non-GAAP) | Year to Dec 2026 | 100.0% | Jul 28, 2026 |
Has Veralto kept its promises?
The record earns a 4/5 assessment. Adjusted earnings per share beat guidance in every quarter checked. Operating margin beat in three of four quarters, while net interest expense was within guidance in four of six. But the annual margin ambition narrowed during 2025, from a positive expansion range to ranges that included no improvement. That makes the promise solid, but conditional.
| What management forecast | Checked | Above | Within | Below |
|---|---|---|---|---|
| Adjusted diluted net earnings per share (non-GAAP) | 7 quarters | 7 | 0 | 0 |
| Adjusted operating profit margin (non-GAAP) | 4 quarters | 3 | 0 | 1 |
| Interest expense, net | 6 quarters | 0 | 4 | 2 |
What has Veralto's revenue and profit trend been?
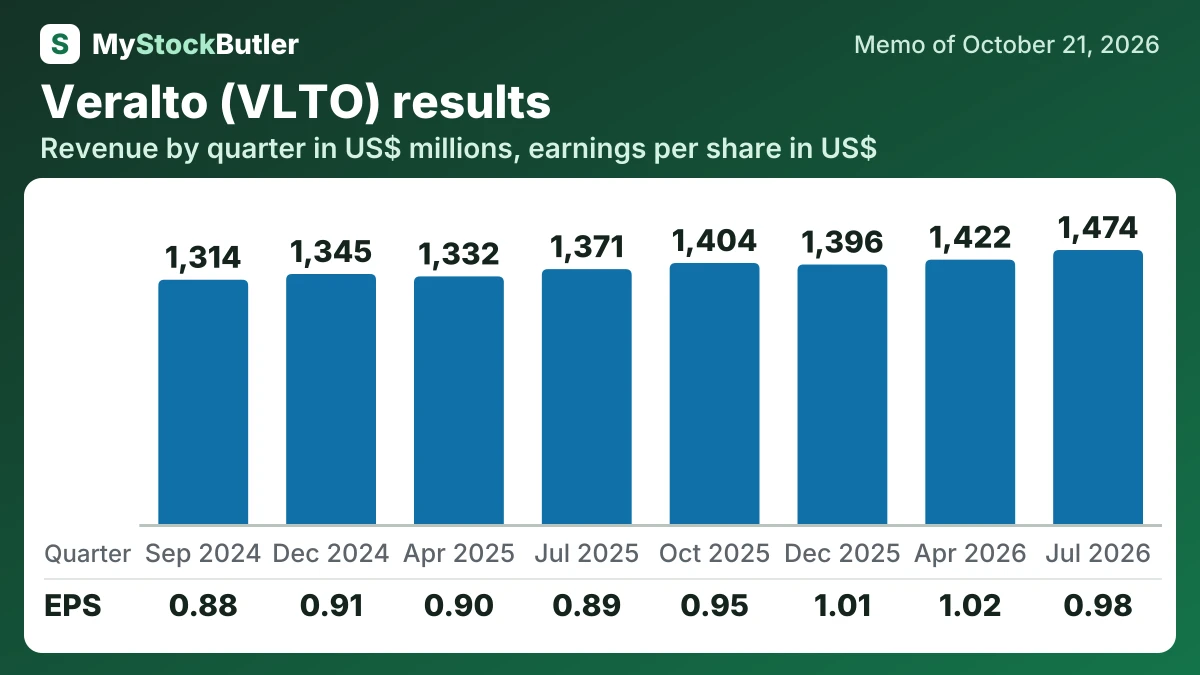
Gross margin shows what remains after direct costs; operating margin also deducts research, selling and administration; net margin includes financing costs and taxes. In 2025, revenue was $5,503 million and net income was $940 million, producing a net margin of about 17.1%. Sales rose across the period, but net income fell through 2024 before recovering.
| Jul 2026 | Apr 2026 | Dec 2025 | Oct 2025 | Jul 2025 | Apr 2025 | Dec 2024 | Sep 2024 | |
|---|---|---|---|---|---|---|---|---|
| Revenue | 1,474 | 1,422 | 1,396 | 1,404 | 1,371 | 1,332 | 1,345 | 1,314 |
| Net income | 241 | 254 | 254 | 239 | 222 | 225 | 227 | 219 |
| EPS, diluted | 0.98 | 1.02 | 1.01 | 0.95 | 0.89 | 0.90 | 0.91 | 0.88 |
| Book value per share | 12.68 | 12.24 | 12.50 | 11.47 | 10.69 | 9.29 | 8.24 | 7.90 |
What this means. The book value per share figures are our calculations, not numbers printed by the company, so they show the company’s net assets divided by the shares outstanding at each period’s end.
What should I watch in Veralto's next results?
The decisive test is whether packaging demand recovers enough to produce sales, margins and cash. The third quarter is the first checkpoint because packaging and color core sales fell 4.4% in the first half of 2026. Management nevertheless expects company-wide second-half core growth of 5.0%–6.0%, supporting its annual target of 4.0%–4.5%.