United Rentals stock forecast 2027–2029
MyStockButler's October 2026 analysis: United Rentals' weighted case is $1,135.58 in October 2027. It hinges on fleet productivity, Specialty margins and used-equipment recovery.
Where could United Rentals' shares be by October 2029?
The weighted case is $1,135.58 in October 2027, a 7% return including dividends. It reaches $1,241.84 in October 2029, a 19% return including dividends. The forecast assigns 25% to the bear case and 55% to the base case. The bull case receives 20%.
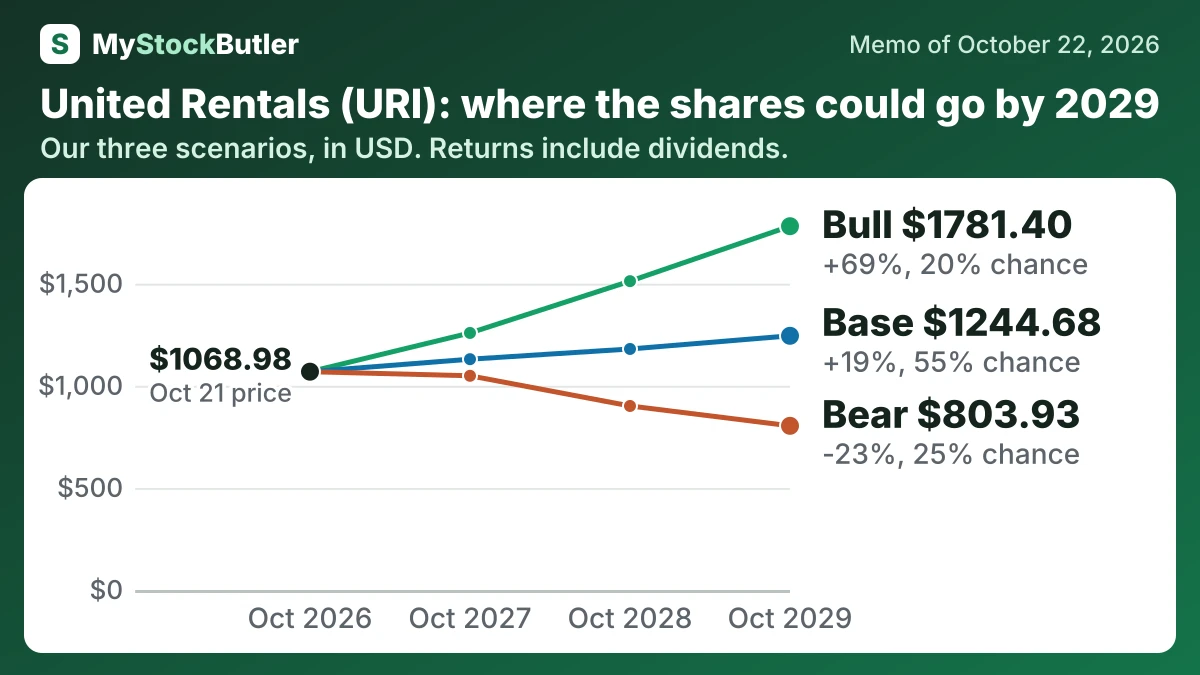
| Case | Probability | October 2027 | October 2028 | October 2029 |
|---|---|---|---|---|
| Bear | 25% | 1048.87 (-1%) | 901.10 (-14%) | 803.93 (-23%) |
| Base | 55% | 1130.21 (+6%) | 1180.25 (+12%) | 1244.68 (+19%) |
| Bull | 20% | 1258.71 (+19%) | 1512.28 (+43%) | 1781.40 (+69%) |
| Weighted | 100% | 1135.58 (+7%) | 1176.87 (+12%) | 1241.84 (+19%) |
What has to go right, and what could go wrong for United Rentals?
The bear case requires delayed projects, excess fleet supply and weaker used-equipment values. EBITDA falls, free cash flow weakens and buybacks slow, while the multiple derates. The shares reach $1,048.87 in October 2027 and $803.93 by October 2029, excluding dividends. Its probability is 25% because the fleet and debt create real cyclical exposure, but strong Q3 demand and raised guidance make a severe downturn less likely.
The bull case reaches $1,258.71 initially and $1,781.40 by the final date. Sustained project demand, improving specialty margins, stronger productivity and disciplined cash generation support both higher EBITDA and an expanding multiple. Its probability is 20% because those gains must persist for several years while URI funds its fleet and larger buybacks.
| October 2027 | October 2028 | October 2029 | |
|---|---|---|---|
| EBITDA | 8,751 (7,601 / 9,053) | 9,200 (7,500 / 9,853) | 9,650 (7,700 / 10,600) |
| Shares (millions) | 60.72 (62.07 / 60.31) | 59.65 (62.04 / 58.92) | 58.68 (61.84 / 57.69) |
| Dividends per share | 8.08 (7.88 / 8.28) | 8.89 (7.88 / 9.94) | 9.78 (7.88 / 11.93) |
| Enterprise value to ebitda | 9.50 (10.50 / 10.00) | 9.20 (9.50 / 10.50) | 9.00 (8.50 / 11.00) |
| Net debt | 14,508 (14,707 / 14,617) | 14,238 (15,346 / 14,353) | 13,812 (15,735 / 13,831) |
How much cash does United Rentals really make?
Revenue growth slowed from 23.1% in 2023 to 4.9% in 2025. Operating margin fell from 26.7% to 24.7%. The company’s real free cash flow was 3.3% of revenue in 2025, while net debt reached $13,770 million. At $1,068.98 per share, URI trades at 23.5x trailing P/E. Free cash flow yield was 1.0%; real free cash flow yield was 0.8%. EPS was nearly flat at $38.69 in 2024 and $38.61 in 2025, while real free cash flow per share rose from $4.61 to $8.17. Average diluted shares fell 2.9% in 2025.
| 2025 | 2024 | 2023 | 2022 | 2021 | |
|---|---|---|---|---|---|
| Cash from operations | 5,190 | 4,546 | 4,704 | 4,433 | 3,689 |
| − Capital spending | 4,528 | 4,127 | 4,070 | 3,690 | 3,198 |
| = Free cash flow | 662 | 419 | 634 | 743 | 491 |
| − Stock pay | 134 | 112 | 94 | 127 | 119 |
| = Real free cash flow | 528 | 307 | 540 | 616 | 372 |
What this means. The company's own free cash flow is higher because it adds money from selling equipment and insurance recoveries, while our count leaves those out.