UHS stock forecast 2027–2029
MyStockButler's October 2026 analysis: UHS's probability-weighted price is $165.82 in October 2027, a 3% loss including dividends. It hinges on patient growth and buybacks supporting earnings while Medicaid, staffing and certification risks restrain them.
Where could UHS's shares be by 2029?
The forecast's central result is modest near-term downside followed by stronger long-term upside. The probability-weighted price is $165.82 in October 2027, a 3% loss including dividends. It is $190.26 in October 2028, an 11% gain. It reaches $228.26 in October 2029, a 34% gain.
At the last date, the range runs from $119.32 in the bear case to $404.94 in the bull case. Today’s price is $172.61. Bear probability is 32%. Base probability is 53%. Bull probability is 15%.
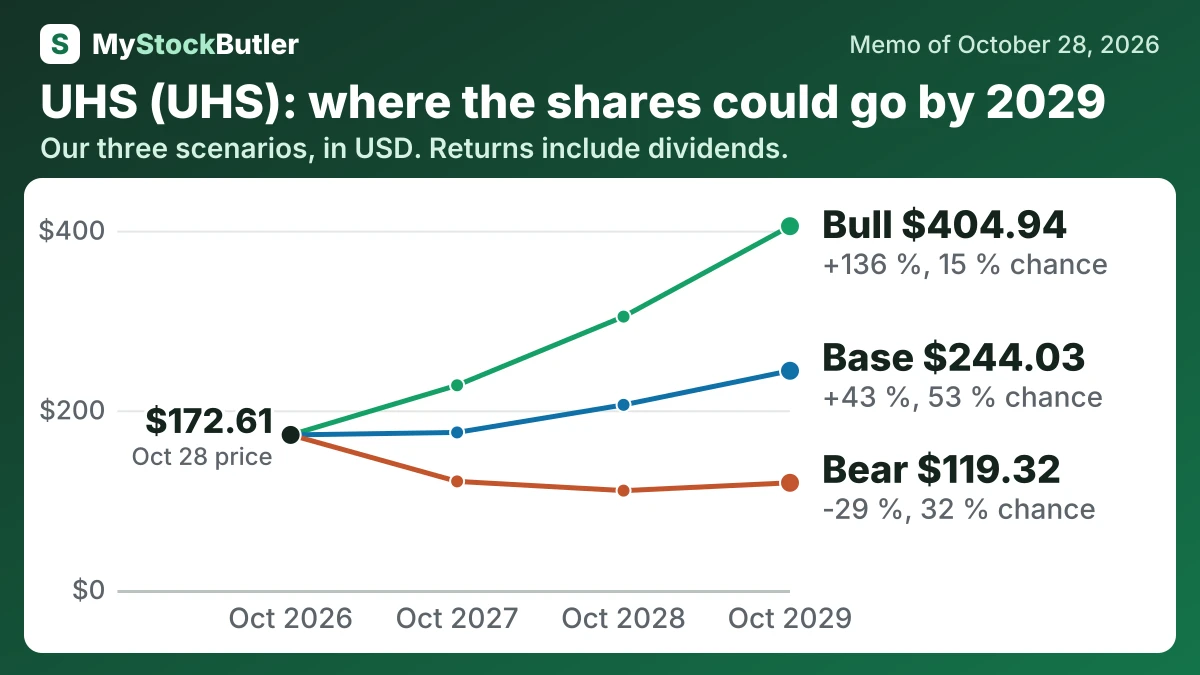
| Case | Probability | October 2027 | October 2028 | October 2029 |
|---|---|---|---|---|
| Bear | 32 % | 120.87 (-30 %) | 110.60 (-35 %) | 119.32 (-29 %) |
| Base | 53 % | 175.39 (+2 %) | 206.08 (+20 %) | 244.03 (+43 %) |
| Bull | 15 % | 227.87 (+32 %) | 304.30 (+77 %) | 404.94 (+136 %) |
| Weighted | 100 % | 165.82 (-3 %) | 190.26 (+11 %) | 228.26 (+34 %) |
What this means. The weighted row is the probability-based average of the bear, base, and bull cases, not a guaranteed share price.
What has to go right for UHS, and what could go wrong?
The drivers pull in opposite directions: patient growth and buybacks support earnings, but Medicaid, staffing and certification risks restrain them.
The base case absorbs much of the Medicaid pressure through patient growth, cost control and gradual facility improvement. It starts at $175.39 and reaches $244.03. Its 53% probability is highest because UHS met or exceeded its tracked measures in four of five reviewed years and current guidance remains near the recent run rate.
How much cash does UHS really make?
UHS generated $1.864 billion from operations in 2025. It spent $1.015 billion on capital projects, leaving free cash flow of $849 million.
| 2025 | 2024 | 2023 | 2022 | 2021 | |
|---|---|---|---|---|---|
| Cash from operations | 1,864,397 | 2,067,101 | 1,267,797 | 996,023 | 883,695 |
| − Capital spending | 1,015,152 | 943,810 | 743,055 | 734,001 | 855,659 |
| = Free cash flow | 849,245 | 1,123,291 | 524,742 | 262,022 | 28,036 |
| − Stock pay | 95,688 | 99,349 | 87,720 | 85,378 | 73,686 |
| = Real free cash flow | 753,557 | 1,023,942 | 437,022 | 176,644 | -45,650 |
| Real free cash flow, % of revenue | 4.3% | 6.5% | 3.1% | 1.3% | -0.4% |
What this means. Stock pay uses no cash today, but it gives employees part of the company, so we subtract its value to show what is truly left for shareholders.
What does an investor pay for UHS today?
| Today (Oct 28, 2026) | |
|---|---|
| Share price | 172.61 |
| Market value (calculated) | 10,173,031.85415 |
| Enterprise value (calculated) | 15,711,623.85415 |
| P/E, last 12 months (calculated) | 7.2x |
| Free cash flow yield (calculated) | 8.3% |
| Real free cash flow yield (calculated) | 7.4% |
What this means. Enterprise value is higher than market value because it includes the company's debt after subtracting its cash.