TKO stock forecast 2027–2029
MyStockButler's October 2026 analysis: The weighted forecast is $148.44 in October 2027, with a 12% loss including dividends. It hinges on rights monetization, cash conversion and acquired-business returns.
Where could TKO's shares be by 2029?
The forecast points to modest downside before a possible recovery. The weighted price is $148.44 in October 2027, a 12% loss including dividends. In October 2028, it is $161.77, a 3% loss. In October 2029, it reaches $176.16, a 7% gain.
The bear probability is 30%. The base probability is 50%. The bull probability is 20%. By October 2029, the range runs from $57.62 in the bear case to $343.33 in the bull case. Today’s price is $173.07.
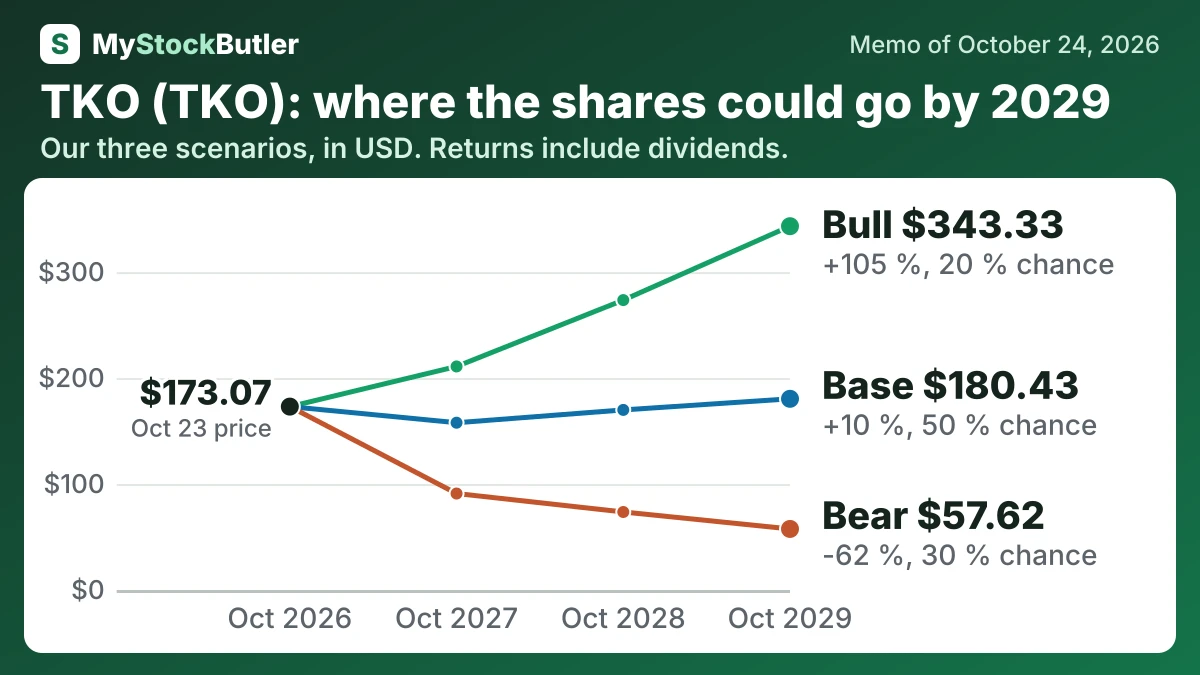
| Case | Probability | October 2027 | October 2028 | October 2029 |
|---|---|---|---|---|
| Bear | 30 % | 91.04 (-46 %) | 73.61 (-54 %) | 57.62 (-62 %) |
| Base | 50 % | 157.86 (-7 %) | 169.95 (+2 %) | 180.43 (+10 %) |
| Bull | 20 % | 210.96 (+24 %) | 273.59 (+62 %) | 343.33 (+105 %) |
| Weighted | 100 % | 148.44 (-12 %) | 161.77 (-3 %) | 176.16 (+7 %) |
What has to go right or wrong for TKO's forecast?
The bear case combines weaker cash conversion with a contracting premium. Distributors struggle to monetize UFC and WWE audiences, flagship attendance softens, new-property costs rise and debt-funded payouts restrict cash. The price falls from $91.04 in October 2027 to $57.62 in October 2029. Its 30% probability reflects rising debt, restricted World Cup prepayments and payouts that exceeded analytical free cash flow, although contracted rights provide some support.
The bull case requires distributors to create durable subscription, retention and advertising value, while IMG, On Location, PBR and boxing improve returns. World Cup cash is released and buybacks compound per-share value. The price rises from $210.96 to $343.33. Its 20% probability reflects the need for several uncertain outcomes to succeed together.
How much cash does TKO really make?
Free cash flow means cash from operations less capital spending. In 2025, operations generated $1.3 billion and capital spending used $127.0 million. Free cash flow was $1.2 billion, compared with a conversion rate of 73% from adjusted EBITDA. That was a major improvement from 20% in 2023, although the changing business perimeter makes the five-year series imperfect.
| 2025 | 2024 | 2023 | 2022 | 2021 | |
|---|---|---|---|---|---|
| Cash from operations | 1,285,725 | 586,084 | 266,159 | 394,760 | 441,235 |
| − Capital spending | 126,953 | 118,818 | 93,753 | 43,102 | 11,131 |
| = Free cash flow | 1,158,772 | 467,266 | 172,406 | 351,658 | 430,104 |
| − Stock pay | 117,588 | 103,466 | 64,512 | 31,598 | 63,855 |
| = Real free cash flow | 1,041,184 | 363,800 | 107,894 | 320,060 | 366,249 |
| Real free cash flow, % of revenue | 22.0% | 7.4% | 3.3% | 12.0% | 35.5% |
What this means. The company's own free cash flow is almost the same as ours; the small difference comes from rounding its reported numbers.
What does an investor pay for TKO today?
| Today (Oct 24, 2026) | |
|---|---|
| Share price | 173.07 |
| Market value (calculated) | 32,756,909 |
| Enterprise value (calculated) | 37,057,461 |
| P/E, last 12 months (calculated) | 60.7x |
| Free cash flow yield (calculated) | 3.5% |
| Real free cash flow yield (calculated) | 3.2% |
What this means. The next twelve months price-to-earnings figure uses analysts' expected profit, not profit the company has already earned.