Melrose stock forecast 2027–2029
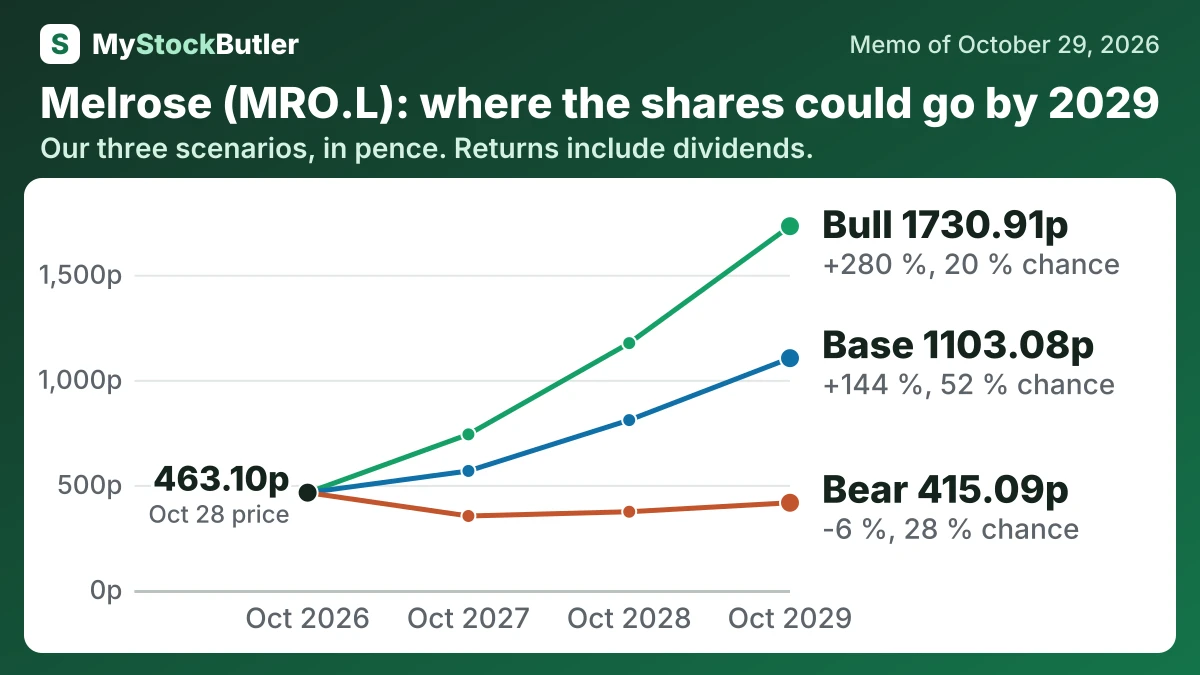
MyStockButler's October 2026 analysis: Melrose's weighted scenario is 1,036.01p by October 2029, with bear, base and bull probabilities of 28%, 52% and 20%. It hinges on operating recovery and engine-partnership cash conversion delivering.
Where could Melrose's shares be by October 2029?
The weighted price is 541.23p in October 2027, a 19% total return including dividends. It reaches 1,036.01p in October 2029, a 129% total return including dividends. The bear case carries 28% probability. The base case carries 52%; the bull case carries 20%. October 2029 outcomes range from 415.09p to 1,730.91p.
| Case | Probability | October 2027 | October 2028 | October 2029 |
|---|---|---|---|---|
| Bear | 28 % | 352.14 (-22 %) | 372.39 (-16 %) | 415.09 (-6 %) |
| Base | 52 % | 566.39 (+24 %) | 808.37 (+78 %) | 1103.08 (+144 %) |
| Bull | 20 % | 740.51 (+62 %) | 1174.57 (+157 %) | 1730.91 (+280 %) |
| Weighted | 100 % | 541.23 (+19 %) | 759.54 (+67 %) | 1036.01 (+129 %) |
What has to go right or wrong for Melrose?
The bear case begins with constrained aircraft production and weak Airframes margins. Garden Grove recovers slowly, GTF cash arrives late and unbilled work continues to rise. By October 2029, debt remains high and the multiple has compressed. The shares reach 352.14p in the first year and 415.09p in the last. Its 28% probability reflects material operational and cash risks, although retained guidance and the rising profit record make a prolonged downside path less likely than base.
The bull case assumes supplier output keeps pace, Garden Grove returns fully, repairs accelerate and partnership cash arrives on schedule. By October 2029, stronger receipts support buybacks and a higher multiple. The shares reach 740.51p initially and 1730.91p finally. Its 20% probability reflects the need for several uncertain improvements to succeed together, while the £600m cash target remains ambitious against recent cash generation.
| October 2027 | October 2028 | October 2029 | |
|---|---|---|---|
| Normal operating profit | 780 (680 / 850) | 930 (735 / 1,050) | 1,080 (820 / 1,250) |
| Shares (millions) | 1,220 (1,237 / 1,207) | 1,195 (1,228 / 1,168) | 1,168 (1,219 / 1,126) |
| Dividends per share | 0.08 (0.07 / 0.08) | 0.08 (0.07 / 0.09) | 0.09 (0.07 / 0.11) |
| Enterprise value to normal operating profit | 10.50 (8.50 / 12.00) | 11.50 (8.00 / 14.00) | 12.50 (7.50 / 16.00) |
| Net debt | 1,280 (1,424 / 1,262) | 1,035 (1,307 / 981) | 616 (1,090 / 510) |
How much cash does Melrose really make?
Free cash flow subtracts capital spending, leases, interest and other cash demands from operating cash. Melrose’s reconstructed 2025 measure also separates stock-plan payments, while the company’s own measure adds property-sale-and-leaseback proceeds. Those definitions answer different questions, so the trend matters more than one headline figure.
| 2025 | 2024 | 2023 | 2022 | |
|---|---|---|---|---|
| Cash from operations | 214 | -121 | -7 | -39 |
| Of which, tied up in working capital | 359 | 329 | 146 | 148 |
| − Capital spending | 86 | 108 | 95 | 69 |
| − Lease payments | 31 | 32 | 32 | 29 |
| − Interest paid | 0 | 0 | 0 | 0 |
| = Free cash flow | 97 | -261 | -134 | -137 |
| − Stock pay | 2 | 1 | 10 | 16 |
| = Real free cash flow | 95 | -262 | -144 | -153 |
| Free cash flow — the company's own count | 125 | -74 | -12 | -88 |
| What its own count adds back | 28 | 187 | 122 | 49 |
| Free cash flow, % of revenue | 2.7% | -7.5% | -4.0% | -4.6% |
| Real free cash flow, % of revenue | 2.6% | -7.6% | -4.3% | -5.2% |
What does an investor pay for Melrose today?
The gap between trailing and forecast P/E is large because forecast earnings are much higher. That forecast uses adjusted profit, which removes items management considers less representative of ongoing trading. It therefore needs a cash-flow check.