Intertek dividend: cash cover and history
MyStockButler's October 2026 analysis: Intertek paid a 165.00p dividend per share in 2025. Its 2025 real free cash flow was £289.3m, but the dividend and buyback together exceeded free cash flow, so the wider payout was debt-funded.
How much does Intertek pay its shareholders?
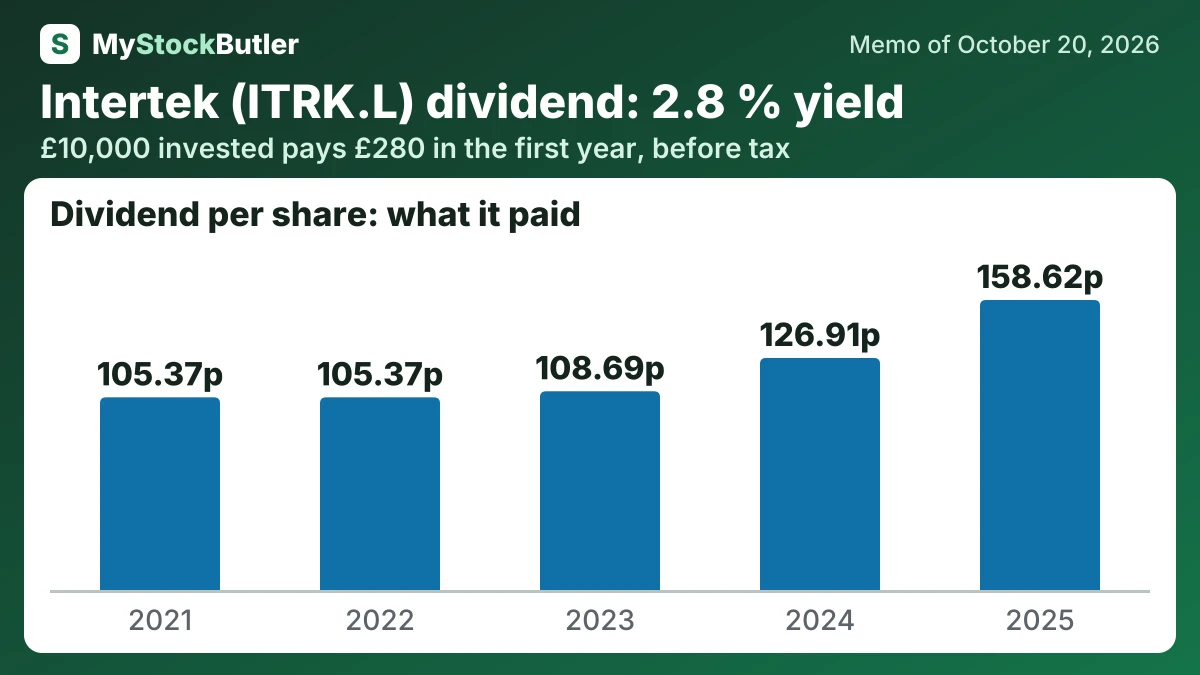
Per-share figures can move differently from total earnings. Diluted EPS rose from 212.70p in 2024 to 216.00p in 2025 even though shareholder earnings fell slightly. The buyback reduced the number of shares sharing the earnings. A dividend of 165.00p describes distribution, not necessarily the cash created during the year.
| 2025 | 2024 | 2023 | 2022 | 2021 | |
|---|---|---|---|---|---|
| − Dividends paid, per share | 158.62 | 126.91 | 108.69 | 105.37 | 105.37 |
| − Share buybacks, per share | 231.38 | 15.21 | 7.15 | 1.42 | 7.04 |
| = FCF not paid out, per share | 86.70 | 84.65 | 106.55 | 113.47 | |
| = Paid out more than FCF, per share | 202.89 |
What this means. The company's own free cash flow per share is higher because it includes money from selling assets and interest received, while our measure also removes the value of shares given to employees as pay.
How much would Intertek's dividend pay you?
£10,000 invested in Intertek at its 2.8% dividend yield (our report of October 20, 2026) pays £280.00 in the first year, before tax. If its dividend per share keeps changing 10.8% a year, as it did from 2021 to 2025, and the dividends are reinvested, year 10 pays £1,031.70, with £5,710.87 received in all.
Before tax. Past dividend growth is not a promise. Information only, not investment advice.
Does Intertek's cash cover its dividend?
The cash waterfall is much less generous. Cash from operations after interest and tax was £536.5m in 2025. Capital spending was £144.5m. Lease payments were £78.4m, leaving stricter free cash flow of £313.6m. Deducting £24.3m of stock-based pay gives analytical “real free cash flow” of £289.3m.
The policy changed in 2025. Intertek raised its dividend payout target and completed a large buyback. A buyback gives cash to shareholders who sell and leaves the remaining owners with a larger percentage of the company, but it does not prove that the business became more valuable. Dividends provide an immediate return; laboratories and acquisitions must earn theirs over time.
Because distributions exceeded free cash flow, Intertek drew more debt and ended the year with substantially higher net debt. That can be sensible for a period, but it converts today’s payout into tomorrow’s obligation. The 2025 decision was therefore a financing choice, not evidence that recurring cash generation could sustain the same payout indefinitely.
| 2025 | 2024 | 2023 | 2022 | 2021 | |
|---|---|---|---|---|---|
| Free cash flow | 313.6 | 387.7 | 340.3 | 362.0 | 382.7 |
| − Dividends paid | 252.2 | 206.1 | 176.3 | 170.6 | 170.6 |
| − Share buybacks | 367.9 | 24.7 | 11.6 | 2.3 | 11.4 |
| = Free cash flow not paid out | 140.8 | 137.3 | 172.5 | 183.7 | |
| = Paid out more than the free cash flow | 322.6 | ||||
| Paid to shareholders | 620.1 | 230.8 | 187.9 | 172.9 | 182.0 |
What this means. In 2025, the company paid shareholders £620.1 million—almost twice its £313.6 million free cash flow—so it had to use savings or new borrowing, which helped raise net debt to £996.8 million.
What could change Intertek's dividend?
Dividends are zero in the base and bull cases because the approved 107.7p final dividend was paid in June 2026, no interim dividend was proposed, and completion removes the public share. The bear case gives £1.08, £1.65 and £1.70, reflecting resumed distributions after failure: first the prior final dividend, then the 2025 annual level, followed by a 3% increase. Cash generation supports that possibility, but the 197.7% payout of free cash flow and higher debt limit confidence.
| October 2027 | October 2028 | October 2029 | |
|---|---|---|---|
| Earnings | 360 (308 / 379) | 386 (290 / 421) | 409 (303 / 461) |
| Shares (millions) | 154 (154 / 154) | 154 (154 / 154) | 154 (154 / 154) |
| Dividends per share | 0.00 (1.08 / 0.00) | 0.00 (1.65 / 0.00) | 0.00 (1.70 / 0.00) |
| Price to earnings | 25.65 (19.00 / 24.37) | 23.95 (18.00 / 21.95) | 22.58 (18.50 / 20.03) |