FirstService stock forecast 2027–2029
MyStockButler's October 2026 analysis: FirstService's weighted price is CAD 228.15 in October 2029, with bear, base and bull probabilities of 30%, 50% and 20%. It hinges on whether recurring Residential fees and Brands’ recovery become cash and earnings without adding leverage.
Where could FirstService's shares be by October 2029?
The probability-weighted price is CAD 212.38 in October 2027, a 4% total return including dividends. It rises to CAD 219.75 in October 2028, an 8% return. By October 2029, the weighted price reaches CAD 228.15, a 14% return from today’s CAD 206.06.
The October 2029 range runs from CAD 109.01 in the bear case to CAD 423.58 in the bull case. The probabilities are 30% bear, 50% base and 20% bull, reflecting strong Residential retention but unresolved Brands and balance-sheet risks.
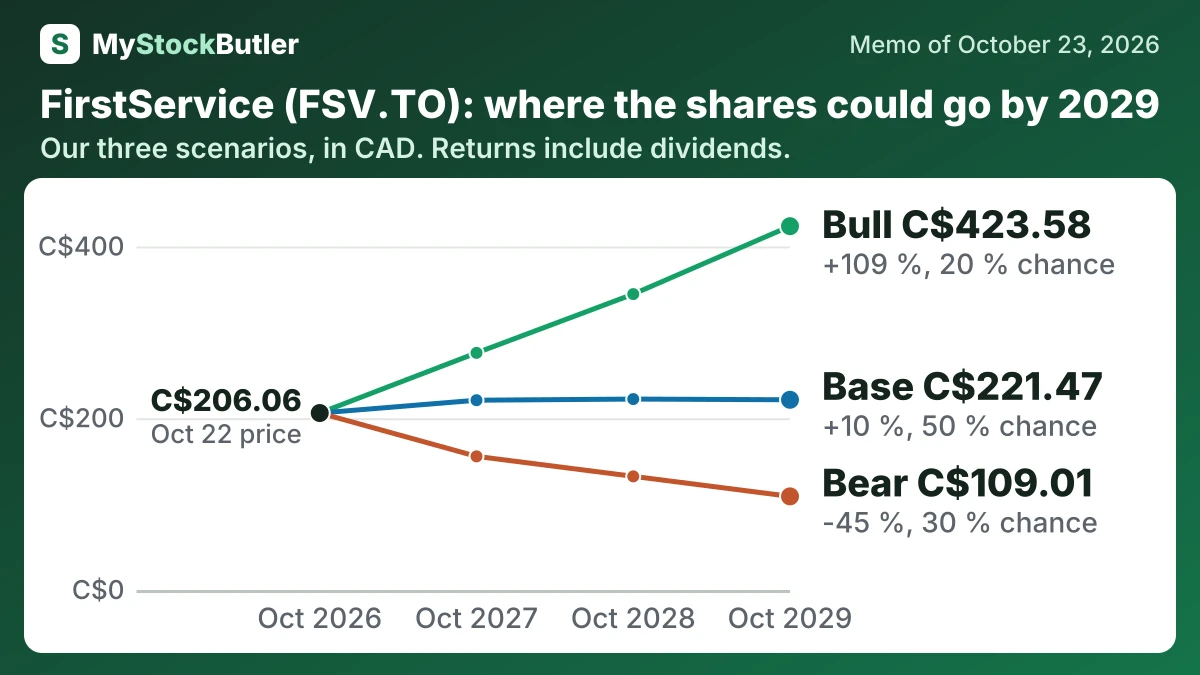
| Case | Probability | October 2027 | October 2028 | October 2029 |
|---|---|---|---|---|
| Bear | 30 % | 155.60 (-24 %) | 132.31 (-34 %) | 109.01 (-45 %) |
| Base | 50 % | 220.97 (+8 %) | 222.30 (+10 %) | 221.47 (+10 %) |
| Bull | 20 % | 276.06 (+35 %) | 344.53 (+69 %) | 423.58 (+109 %) |
| Weighted | 100 % | 212.38 (+4 %) | 219.75 (+8 %) | 228.15 (+14 %) |
What has to go right for FirstService's base case?
The base assumes 5% annual revenue growth from roughly USD 5,700 million and margins rising gradually from 2.69% to 2.79%. That sits near the recent 2.6% margin, while Residential has mid-single-digit growth guidance and Brands has returned to positive organic growth. The bear assumes 3% growth and margins compressing from 2.25% to 2.05%, because roofing margins, restoration volatility and financing costs remain weak. The bull assumes 7% growth initially, then 8%, with margins expanding from 2.895% to 3.25% as deferred roofing work converts profitably and job costing improves. Q3 revenue grew, but operating income declined and gross margin weakened, so the bull requires evidence beyond the current quarter.
The bull case reaches CAD 276.06 initially and CAD 423.58 by October 2029. Restoration normalizes, delayed roofing work earns acceptable margins, job costing improves, Residential adds services and acquisitions remain disciplined. Buybacks then become more affordable and investors reward durable growth. The probability is 20% because several conditions must succeed together while Q3 gross margin fell and Brands’ adjusted EBITDA was approximately flat.
How much cash does FirstService really make?
Operating cash flow was US$445,941 thousand in 2025, up from US$285,674 thousand in 2024. After capital spending, conventional free cash flow was US$318,236 thousand. After treating stock compensation as an economic cost, it was US$290,849 thousand.
| 2025 | 2024 | 2023 | 2022 | 2021 | |
|---|---|---|---|---|---|
| Cash from operations | 445,941 | 285,674 | 280,360 | 105,893 | 167,269 |
| Of which, freed from working capital | 54,329 | ||||
| Of which, tied up in working capital | 39,833 | 5,628 | 175,061 | 78,119 | |
| − Capital spending | 127,705 | 112,798 | 92,734 | 77,609 | 58,204 |
| Interest paid (already included in cash from operations) | 73,311 | 77,390 | 49,717 | 23,687 | 14,632 |
| − Stock pay | 27,387 | 25,311 | 21,385 | 18,046 | 14,746 |
What this means. Stock pay is subtracted even though it uses no cash because it gives employees part of the company through shares.
What does an investor pay for FirstService today?
| Today (Oct 23, 2026) | |
|---|---|
| Share price | 206.06 |
| Market value (calculated) | 8,998,592.806 |
| Enterprise value (calculated) | 10,954,448.233 |
| P/E, last 12 months (calculated) | 44.8x |
| P/E, next 12 months (calculated) | 24.3x |
What this means. The market value uses the number of shares counted on August 12, while the share price is from October 23, so it may not exactly show what the company is worth today.