First Solar stock forecast 2027–2029
MyStockButler's October 2026 analysis: First Solar's weighted price is $203.77 in October 2027. The forecast hinges on South Carolina’s 2027 ramp, the CuRe rollout and bookings replacing deliveries through 2027–2029.
Where could First Solar's shares be by October 2029?
The probability-weighted price is $203.77 in October 2027, including dividends, for a 15% return from today’s $176.89. It rises to $245.29 in October 2028, a 39% return. By October 2029, the weighted price reaches $292.89, a 66% return.
The range is wide. The October 2029 bear price is $114.68, while the bull price is $527.36. The bear case has 30% probability, the base case 50%, and the bull case 20%. The table shows the path behind those weighted outcomes.
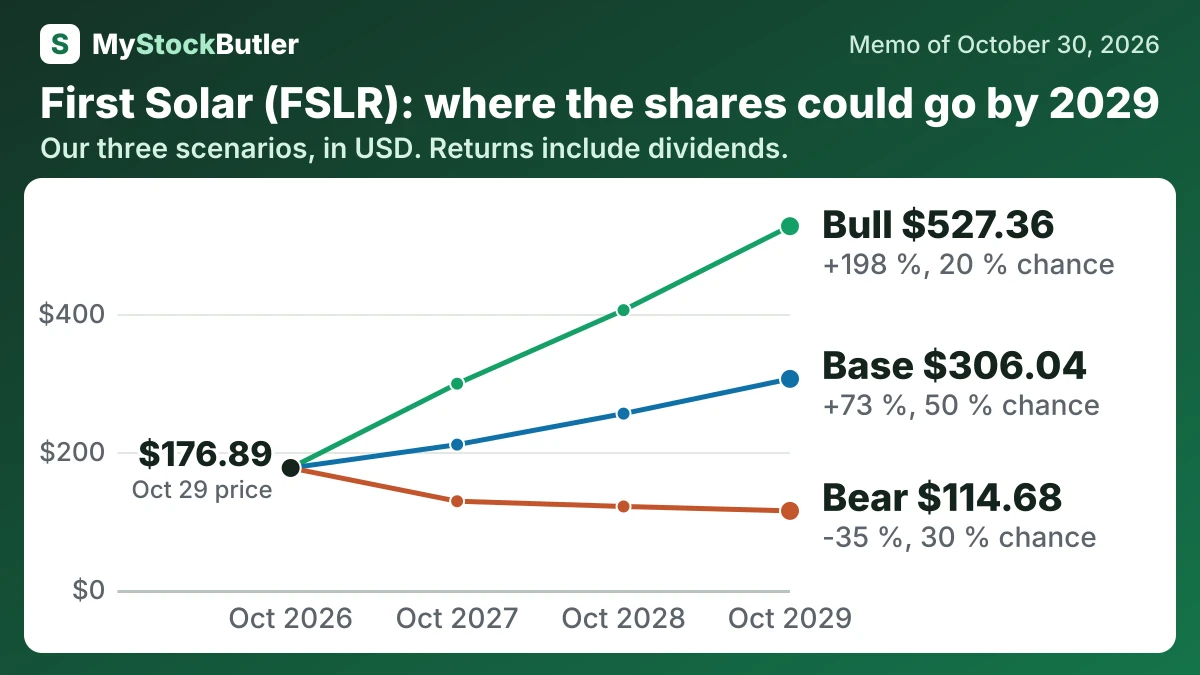
| Case | Probability | October 2027 | October 2028 | October 2029 |
|---|---|---|---|---|
| Bear | 30 % | 128.65 (-27 %) | 121.06 (-32 %) | 114.68 (-35 %) |
| Base | 50 % | 210.73 (+19 %) | 255.68 (+45 %) | 306.04 (+73 %) |
| Bull | 20 % | 299.06 (+69 %) | 405.65 (+129 %) | 527.36 (+198 %) |
| Weighted | 100 % | 203.77 (+15 %) | 245.29 (+39 %) | 292.89 (+66 %) |
What this means. The weighted value is the probability-based average of the three cases, not a guaranteed share price.
What has to go right or wrong for First Solar?
Our weighted price is $203.77 in October 2027. That implies a 15% return. It is $292.89 in October 2029. That implies a 66% return. The bear case has a 30% probability; the base and bull cases have 50% and 20%, respectively. The forecast turns on South Carolina’s 2027 ramp and the rollout of CuRe, First Solar’s process for improving panel performance in heat and low light. It also depends on the Malaysia capacity decision in the first half of 2027. Finally, bookings must replace deliveries through 2027–2029. Remember: the forecast depends on the South Carolina ramp, the CuRe rollout and bookings replacing deliveries.
| October 2027 | October 2028 | October 2029 | |
|---|---|---|---|
| EBITDA | 2,850 (2,200 / 3,200) | 3,150 (2,310 / 3,800) | 3,450 (2,425 / 4,400) |
| Shares (millions) | 107 (108 / 106) | 107 (108 / 105) | 107 (108 / 106) |
| Enterprise value to ebitda | 7.00 (5.50 / 9.00) | 7.50 (5.00 / 10.00) | 8.00 (4.50 / 11.00) |
| Net debt | -2,644 (-1,758 / -3,029) | -3,722 (-1,520 / -4,794) | -5,054 (-1,496 / -7,339) |
What this means. The negative net debt numbers mean the company has more cash than borrowed money, which is generally safer.
How much cash does First Solar really make?
The table’s “real free cash flow” makes an additional deduction for stock compensation. Issuing shares is not a cash payment in that period, but it has an economic cost for existing owners. The deduction is an analytical measure, not a replacement for the cash-flow statement.
| 2025 | 2024 | 2023 | 2022 | 2021 | |
|---|---|---|---|---|---|
| Cash from operations | 2,057,105 | 1,217,999 | 602,260 | 873,369 | 237,559 |
| − Capital spending | 869,875 | 1,526,076 | 1,386,775 | 903,605 | 540,291 |
| = Free cash flow | 1,187,230 | -308,077 | -784,515 | -30,236 | -302,732 |
| − Stock pay | 19,223 | 28,104 | 34,219 | 28,656 | 20,902 |
| = Real free cash flow | 1,168,007 | -336,181 | -818,734 | -58,892 | -323,634 |
| Real free cash flow, % of revenue | 22.4% | -8.0% | -24.7% | -2.2% | -11.1% |
What this means. A blank working-capital cell does not mean zero; it means the table shows only the years when cash was freed or tied up.
What does an investor pay for First Solar today?
At $176.89 a share, the market values all First Solar’s shares at about $19.0 billion. Enterprise value, which isolates the operating business after allowing for debt and cash, is about $17.5 billion. An investor therefore owns both the solar business and a claim on the company’s cash.