Comfort Systems USA stock forecast 2027–2029
MyStockButler's October 2026 analysis: Comfort Systems USA's weighted scenario is $1,348.39 in October 2027, with 60% probability. Comfort Systems USA's outcome hinges on technology investment and project execution.
Where could Comfort Systems USA's shares be in each forecast year?
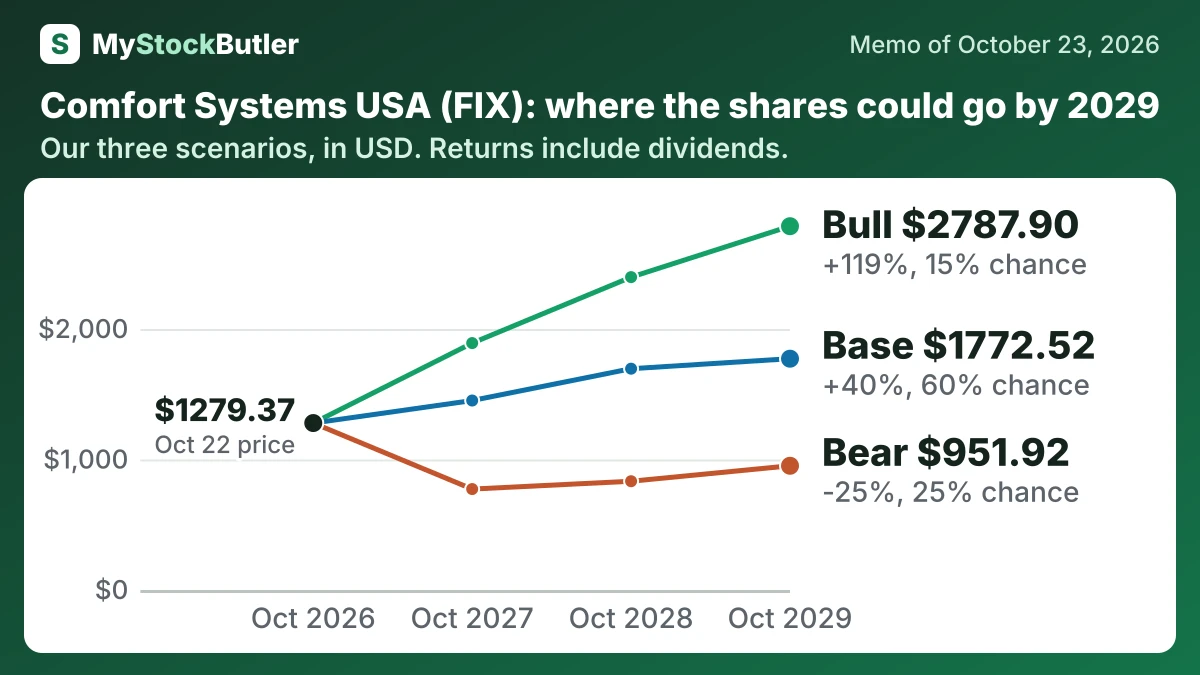
The weighted share price is $1,348.39 in October 2027, $1,585.57 in October 2028 and $1,719.68 in October 2029. Including dividends, those outcomes represent gains of 6%, 25% and 36% from $1,279.37. By the last date, the bear case reaches $951.92 while the bull case reaches $2,787.90, against today’s price.
| Case | Probability | October 2027 | October 2028 | October 2029 |
|---|---|---|---|---|
| Bear | 25% | 773.51 (-39%) | 833.58 (-34%) | 951.92 (-25%) |
| Base | 60% | 1451.98 (+14%) | 1695.90 (+33%) | 1772.52 (+40%) |
| Bull | 15% | 1892.17 (+48%) | 2397.59 (+88%) | 2787.90 (+119%) |
| Weighted | 100% | 1348.39 (+6%) | 1585.57 (+25%) | 1719.68 (+36%) |
What has to go right—or wrong—for Comfort Systems USA?
The base case assumes normal operating profit of $2,400 million, $2,784 million and $3,023 million. Those figures use revenue of $15,000 million, $17,400 million and $19,500 million with margins of 16%, 16% and 15.5%. The margins sit below or near the latest 16.7% trailing margin, recognizing that the rise from $188 million in 2021 to $1,315 million in 2025 is not a full-cycle average. The bear case falls to $1,488 million before recovering to $1,950 million as technology work slows; the bull case reaches $3,740 million if data-center demand and modular capacity support 17% margins.
Operating profit reaches $2,720 million initially and $3,740 million by 2029, while the multiple rises to 24 times. The share price reaches $1,892.17 first and $2,787.90 last. Its 15% probability reflects credible demand and capacity upside, but also the need for strong margins, cash conversion and execution at the same time.
| October 2027 | October 2028 | October 2029 | |
|---|---|---|---|
| Normal operating profit | 2,400 (1,488 / 2,720) | 2,784 (1,708 / 3,264) | 3,023 (1,950 / 3,740) |
| Shares (millions) | 34.90 (35.00 / 34.82) | 34.81 (35.01 / 34.65) | 34.72 (35.02 / 34.48) |
| Dividends per share | 4.00 (4.00 / 4.00) | 4.80 (4.00 / 5.20) | 5.76 (4.00 / 6.76) |
| Enterprise value to normal operating profit | 20.00 (17.00 / 23.00) | 20.00 (16.00 / 24.00) | 19.00 (16.00 / 24.00) |
| Net debt | -2,680 (-1,780 / -3,333) | -3,361 (-1,859 / -4,750) | -4,112 (-2,140 / -6,378) |
How much cash does Comfort Systems USA really make?
In 2025, operating cash flow was about $1.2 billion, or 116% of net income. After $154.9 million of capital spending, free cash flow was about $1.0 billion. Deducting $21.8 million of stock-based pay produces the essay’s real free cash flow, which treats employee shares as an economic cost to shareholders.
| 2025 | 2024 | 2023 | 2022 | 2021 | |
|---|---|---|---|---|---|
| Cash from operations | 1,186,356 | 849,057 | 639,568 | 301,531 | 180,151 |
| − Capital spending | 154,903 | 111,071 | 94,838 | 48,359 | 22,330 |
| = Free cash flow | 1,031,453 | 737,986 | 544,730 | 253,172 | 157,821 |
| − Stock pay | 21,809 | 16,646 | 12,939 | 10,532 | 10,593 |
| = Real free cash flow | 1,009,644 | 721,340 | 531,791 | 242,640 | 147,228 |
| Real free cash flow, % of revenue | 11.1% | 10.3% | 10.2% | 5.9% | 4.8% |
What this means. The company's free cash flow is slightly higher because it adds back money from selling assets, while our count leaves that money out.
What does Comfort Systems USA's valuation say about earnings and cash?
Using the forward earnings multiple, today’s share price implies expected earnings of about US$49.02 per share. That is an earnings expectation, not a cash payment. The low free-cash-flow yield means the investment depends mainly on what those earnings become over time.