Applied Materials vs KLA Corporation stock: side by side (October 2026)
How do Applied Materials and KLA Corporation compare?
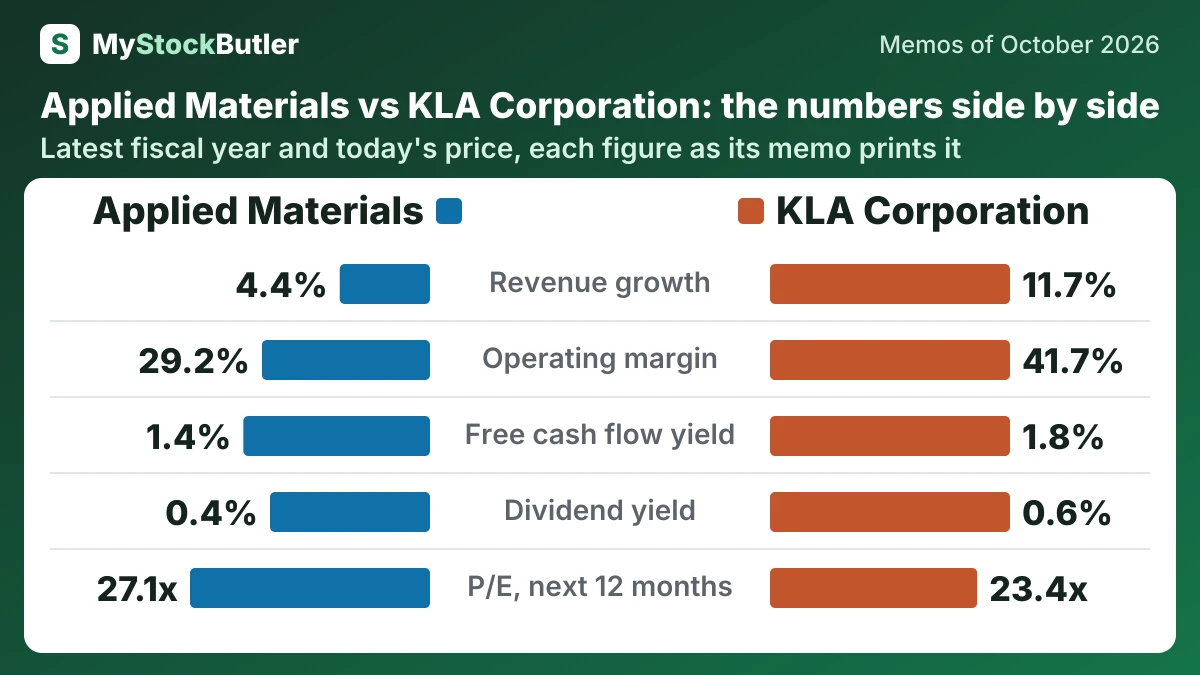
| Applied Materials AMAT | KLA Corporation KLAC | |
|---|---|---|
| Revenue growth | 4.4%Oct 2025 | 11.7%Jun 2026 |
| Operating margin | 29.2%Oct 2025 | 41.7%Jun 2026 |
| Free cash flow | 5,698US$ millions · Oct 2025 | 3,767,134US$ thousands · Jun 2026 |
| Free cash flow yield | 1.4%Today (Oct 11, 2026) | 1.8%Today (Oct 28, 2026) |
| Dividend yield | 0.4%Today (Oct 11, 2026) | 0.6%Today (Oct 28, 2026) |
| P/E, last 12 months | 43.7xToday (Oct 11, 2026) | 39.7xToday (Oct 28, 2026) |
| P/E, next 12 months | 27.1xToday (Oct 11, 2026) | 23.4xToday (Oct 28, 2026) |
| Weighted price forecast, about 1 year | 352.91 (-29%)October 2027 | 186.59 (+18 %)October 2027 |
| Weighted price forecast, about 3 years | 384.53 (-23%)October 2029 | 230.40 (+47 %)October 2029 |
Who leads on what?
| Leads | The lead is | |
|---|---|---|
| Revenue growth | KLA Corporation | The higher figure |
| Operating margin | KLA Corporation | The higher figure |
| Free cash flow | — | The higher figure |
| Free cash flow yield | KLA Corporation | The higher figure |
| Dividend yield | KLA Corporation | The higher figure |
| P/E, last 12 months | KLA Corporation | The lower figure |
| P/E, next 12 months | KLA Corporation | The lower figure |
| Weighted price forecast, about 1 year | KLA Corporation | The higher weighted return |
| Weighted price forecast, about 3 years | KLA Corporation | The higher weighted return |
What does each company do?
Applied Materials sells semiconductor fabrication equipment to chipmakers and packaging manufacturers.
Applied Materials (AMAT), from our memo of October 11, 2026 · Applied Materials stock forecast
KLA Corporation sells inspection, measurement, software and service tools for chip and electronics manufacturers.
KLA Corporation (KLAC), from our memo of October 28, 2026 · KLA Corporation stock forecast
How big are Applied Materials and KLA Corporation?
At Applied Materials, revenue came to US$9,115 million in the quarter to July 2026; at KLA Corporation, it came to US$4,136,015 thousand in the quarter to September 2026.
How fast are Applied Materials and KLA Corporation growing, and what did their latest results show?
Revenue at Applied Materials grew 4.4% in the year to October 2025, and revenue at KLA Corporation grew 11.7% in the year to June 2026.
Revenue, gross margin and operating income all strengthened, and operating expenses grew more slowly than sales. Across the recent quarters, the sequence supports a recovery rather than a single isolated spike.
Applied Materials (AMAT), from our memo of October 11, 2026 · Applied Materials earnings
The September 2026 quarter accelerated sharply, and management’s next-quarter forecast suggests the strength may extend beyond one reporting period.
KLA Corporation (KLAC), from our memo of October 28, 2026 · KLA Corporation earnings
How much cash do Applied Materials and KLA Corporation generate, and where does it go?
Applied Materials’ free cash flow was US$5,698 million in the year to October 2025; KLA Corporation’s was US$3,767,134 thousand in the year to June 2026. At Applied Materials, the dividend yield was 0.4% on October 11, 2026; at KLA Corporation, it was 0.6% on October 28, 2026.
Operating cash flow records money collected from customers after cash payments to employees, suppliers and governments. Free cash flow then subtracts capital spending on facilities and equipment. A stricter measure also subtracts stock compensation, because employees receive ownership with economic value even though the award requires no immediate cash payment.
Applied Materials (AMAT), from our memo of October 11, 2026 · Applied Materials stock forecast
A stricter view also treats stock compensation as a cost to existing shareholders. It is not a second cash payment in the same way as wages, but issuing shares can dilute ownership. On that basis, fiscal 2026 cash generation was slightly lower than the year before.
KLA Corporation (KLAC), from our memo of October 28, 2026 · KLA Corporation stock forecast
What does an investor pay for Applied Materials and KLA Corporation today?
Applied Materials traded at 43.7x the last 12 months’ earnings and 27.1x the next 12 months’ on October 11, 2026; KLA Corporation traded at 39.7x the last 12 months’ earnings and 23.4x the next 12 months’ on October 28, 2026. Applied Materials’ free cash flow yield was 1.4% on October 11, 2026; KLA Corporation’s was 1.8% on October 28, 2026.
At $158.77 on October 28, 2026, KLA’s market value was about $207.2 billion. Its trailing P/E was 39.7 times, meaning investors paid about $39.70 for each $1 of the earnings used in that calculation. Its next-12-month P/E was 23.4 times, which implies that investors expect higher earnings. Because chip-equipment purchases arrive in waves, either ratio can mislead when profits sit unusually high or low in the cycle.
KLA Corporation (KLAC), from our memo of October 28, 2026 · KLA Corporation stock forecast